Kevin W Monroe
on 24 September 2015
As Cory alluded to in our intro post, we’re excited to talk about a bundle that demonstrates an end-to-end Big Data solution: Realtime Syslog Analytics. Working with log data is a common Big Data task, and in this post, we’ll show how this bundle enables you to ingest, process, and visualize syslog data. This gives an admin the ability to know about login, cron, and other activity on a monitored system.
First, let’s see what the deployed bundle looks like:
This could easily be extended to work with different logs on different services in your cluster. The rsyslog-forwarder charm can funnel events from any service that generates syslog data into this bundle. In this example, we’re using the HDFS Master unit (our Namenode) as the data source.
We won’t duplicate too much of the bundle’s README here; you can find usage, testing, and scaling information from the previous link. However, we think restating some of the Overview is important to help describe what you see in the above image.
Bundle Overview
This bundle models a 10-service scalable cluster on 9 units, which could be physical machines, VMs, etc, depending on the hardware on which it is deployed. It contains the following services (each of which corresponds to one of the icons above):
- HDFS Master (1 unit)
- Rsyslog Forwarder (colocated on the HDFS Master unit)
- HDFS Secondary NameNode (1 unit)
- YARN Master (1 unit)
- Compute Slaves (scaled to 3 units)
- Spark (1 unit)
- Zeppelin (colocated on the Spark unit)
- Flume-HDFS (1 unit)
- Flume-Syslog (1 unit)
- Plugin (a helper / connector service, colocated on the Spark and Flume-HDFS units)
Deploying and relating all of these services is a simple one-liner:
juju quickstart realtime-syslog-analyticsYou can learn more about getting started with Juju and quickstart here. When you’re ready, read on to dive a little deeper into the capabilities of this bundle.
Deployment Status
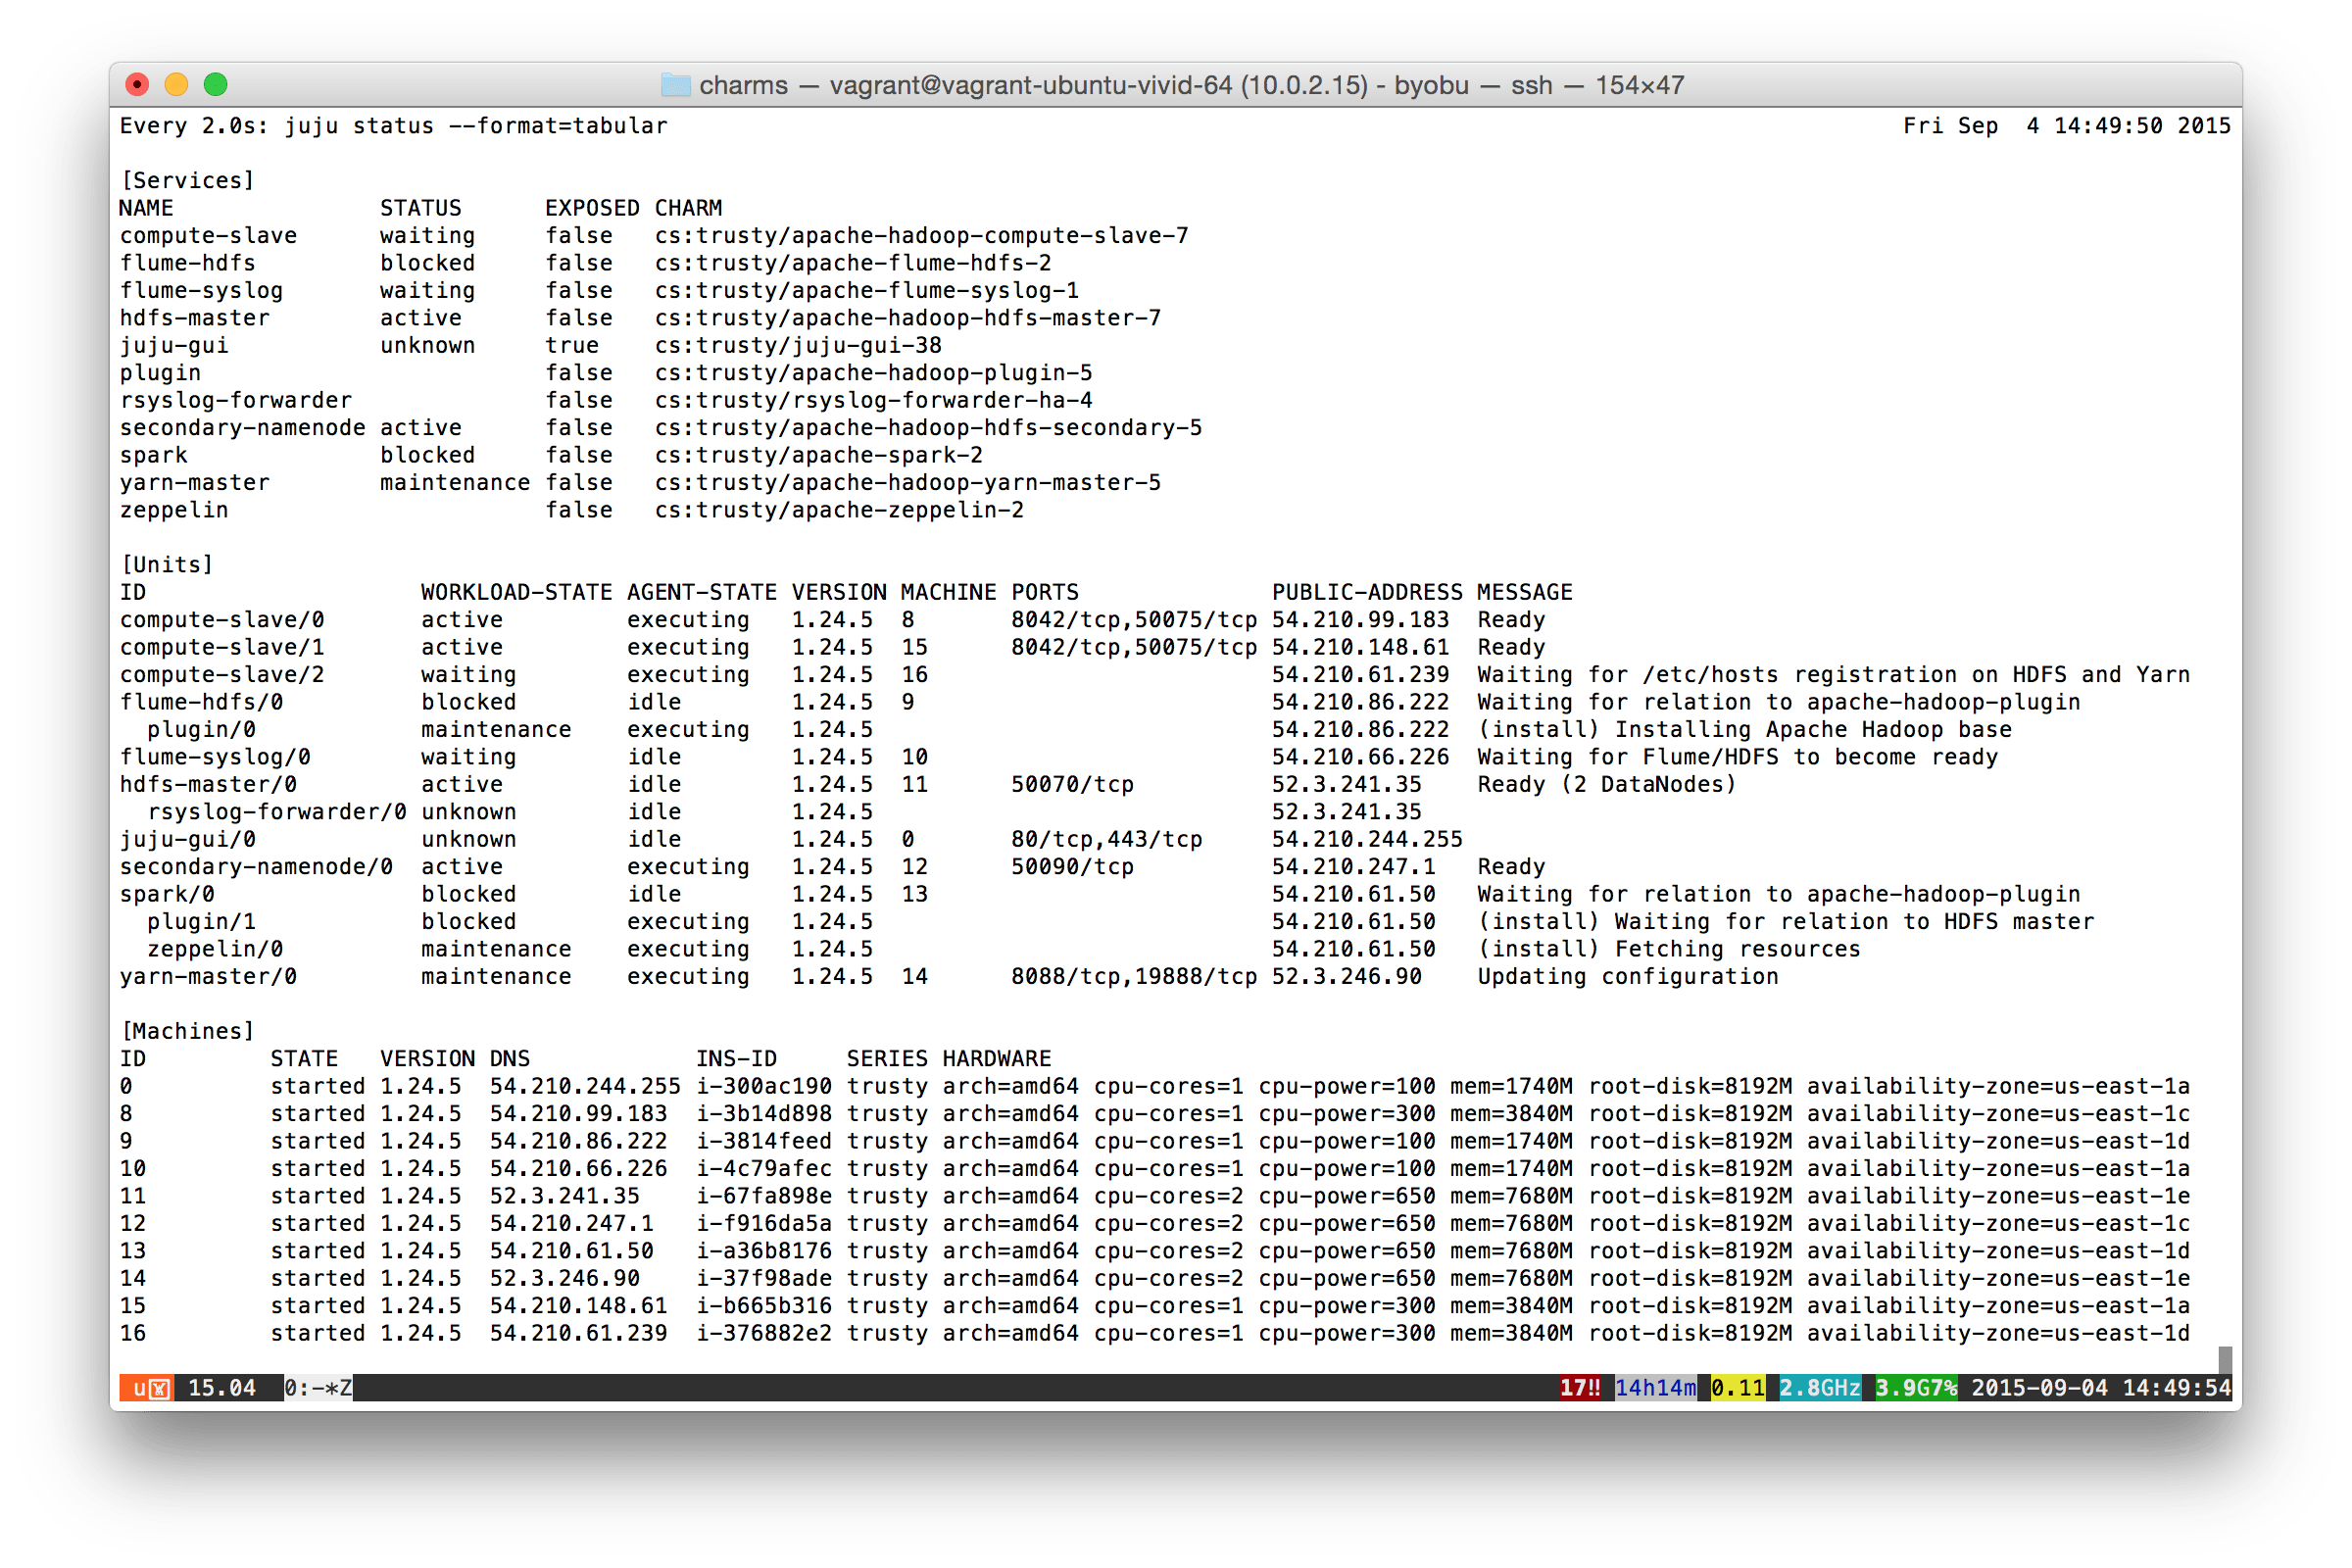
This bundle supports extended status reporting. During the deployment, start up a terminal and enter the following to monitor progress:
watch juju status --format=tabularYou’ll see something similar to the following. Note the MESSAGE column in the middle-right, which describes what each charm in the bundle is doing:

Once all of the charms have settled to a Ready state, deployment is complete. Use Ctrl-c to break out of the watch entered above.
Note: The PORTS and PUBLIC-ADDRESS columns from the above output help identify services that may provide management interfaces. Some environments (e.g., AWS, Azure, etc) have firewalls that will block public access to these by default. In these environments, you will need to explicitly expose the service to enable access. For example, to allow access to the Spark and Zeppelin web interfaces, you would enter the following:
juju expose spark
juju expose zeppelin
Ingestion
This bundle uses a pair of Apache Flume agents to coordinate the storing of syslog events into Hadoop’s Distributed File System (HDFS). Data flows into our environment as follows:
- Syslog events are generated on the HDFS Master (in this example)
- Rsyslog (configured on the HDFS Master) forwards these events to Flume-Syslog
- Flume-Syslog serializes these events and forwards them to Flume-HDFS
- Flume-HDFS (which is “plugged in” to our Hadoop core) writes event data to HDFS
At this point, you could SSH to the Flume-HDFS unit and hdfs dfs -cat an event:
juju ssh flume-syslog/0
hdfs dfs -cat /user/flume/flume-syslog/<yyyy-mm-dd>/FlumeData.<id>
But that’s not very useful if you want to derive meaning from your data (e.g., at what time of day do I get the most failed login attempts to my HDFS Master, and where are they coming from?). For that, you’ll need to execute jobs and analyze results.
Processing / Visualization
Once syslog data makes it to HDFS, we leverage services that can process jobs and visualize results. The processing/visualization flow goes like this:
- Submit a Spark job
- Spark uses the YARN Master to send work to (and retrieve results from) Compute Slaves
- The Zeppelin web interface lets you view job status and results
The “Submit a Spark job” bullet is certainly vague. You could SSH to the Spark unit and manually submit a job. For example, estimate π with the following:
juju ssh spark/0
spark-submit --class org.apache.spark.examples.SparkPi \
 --master yarn-client /usr/lib/spark/lib/spark-examples*.jar 10
But that’s about as cool as using hdfs dfs -cat to view syslog events.
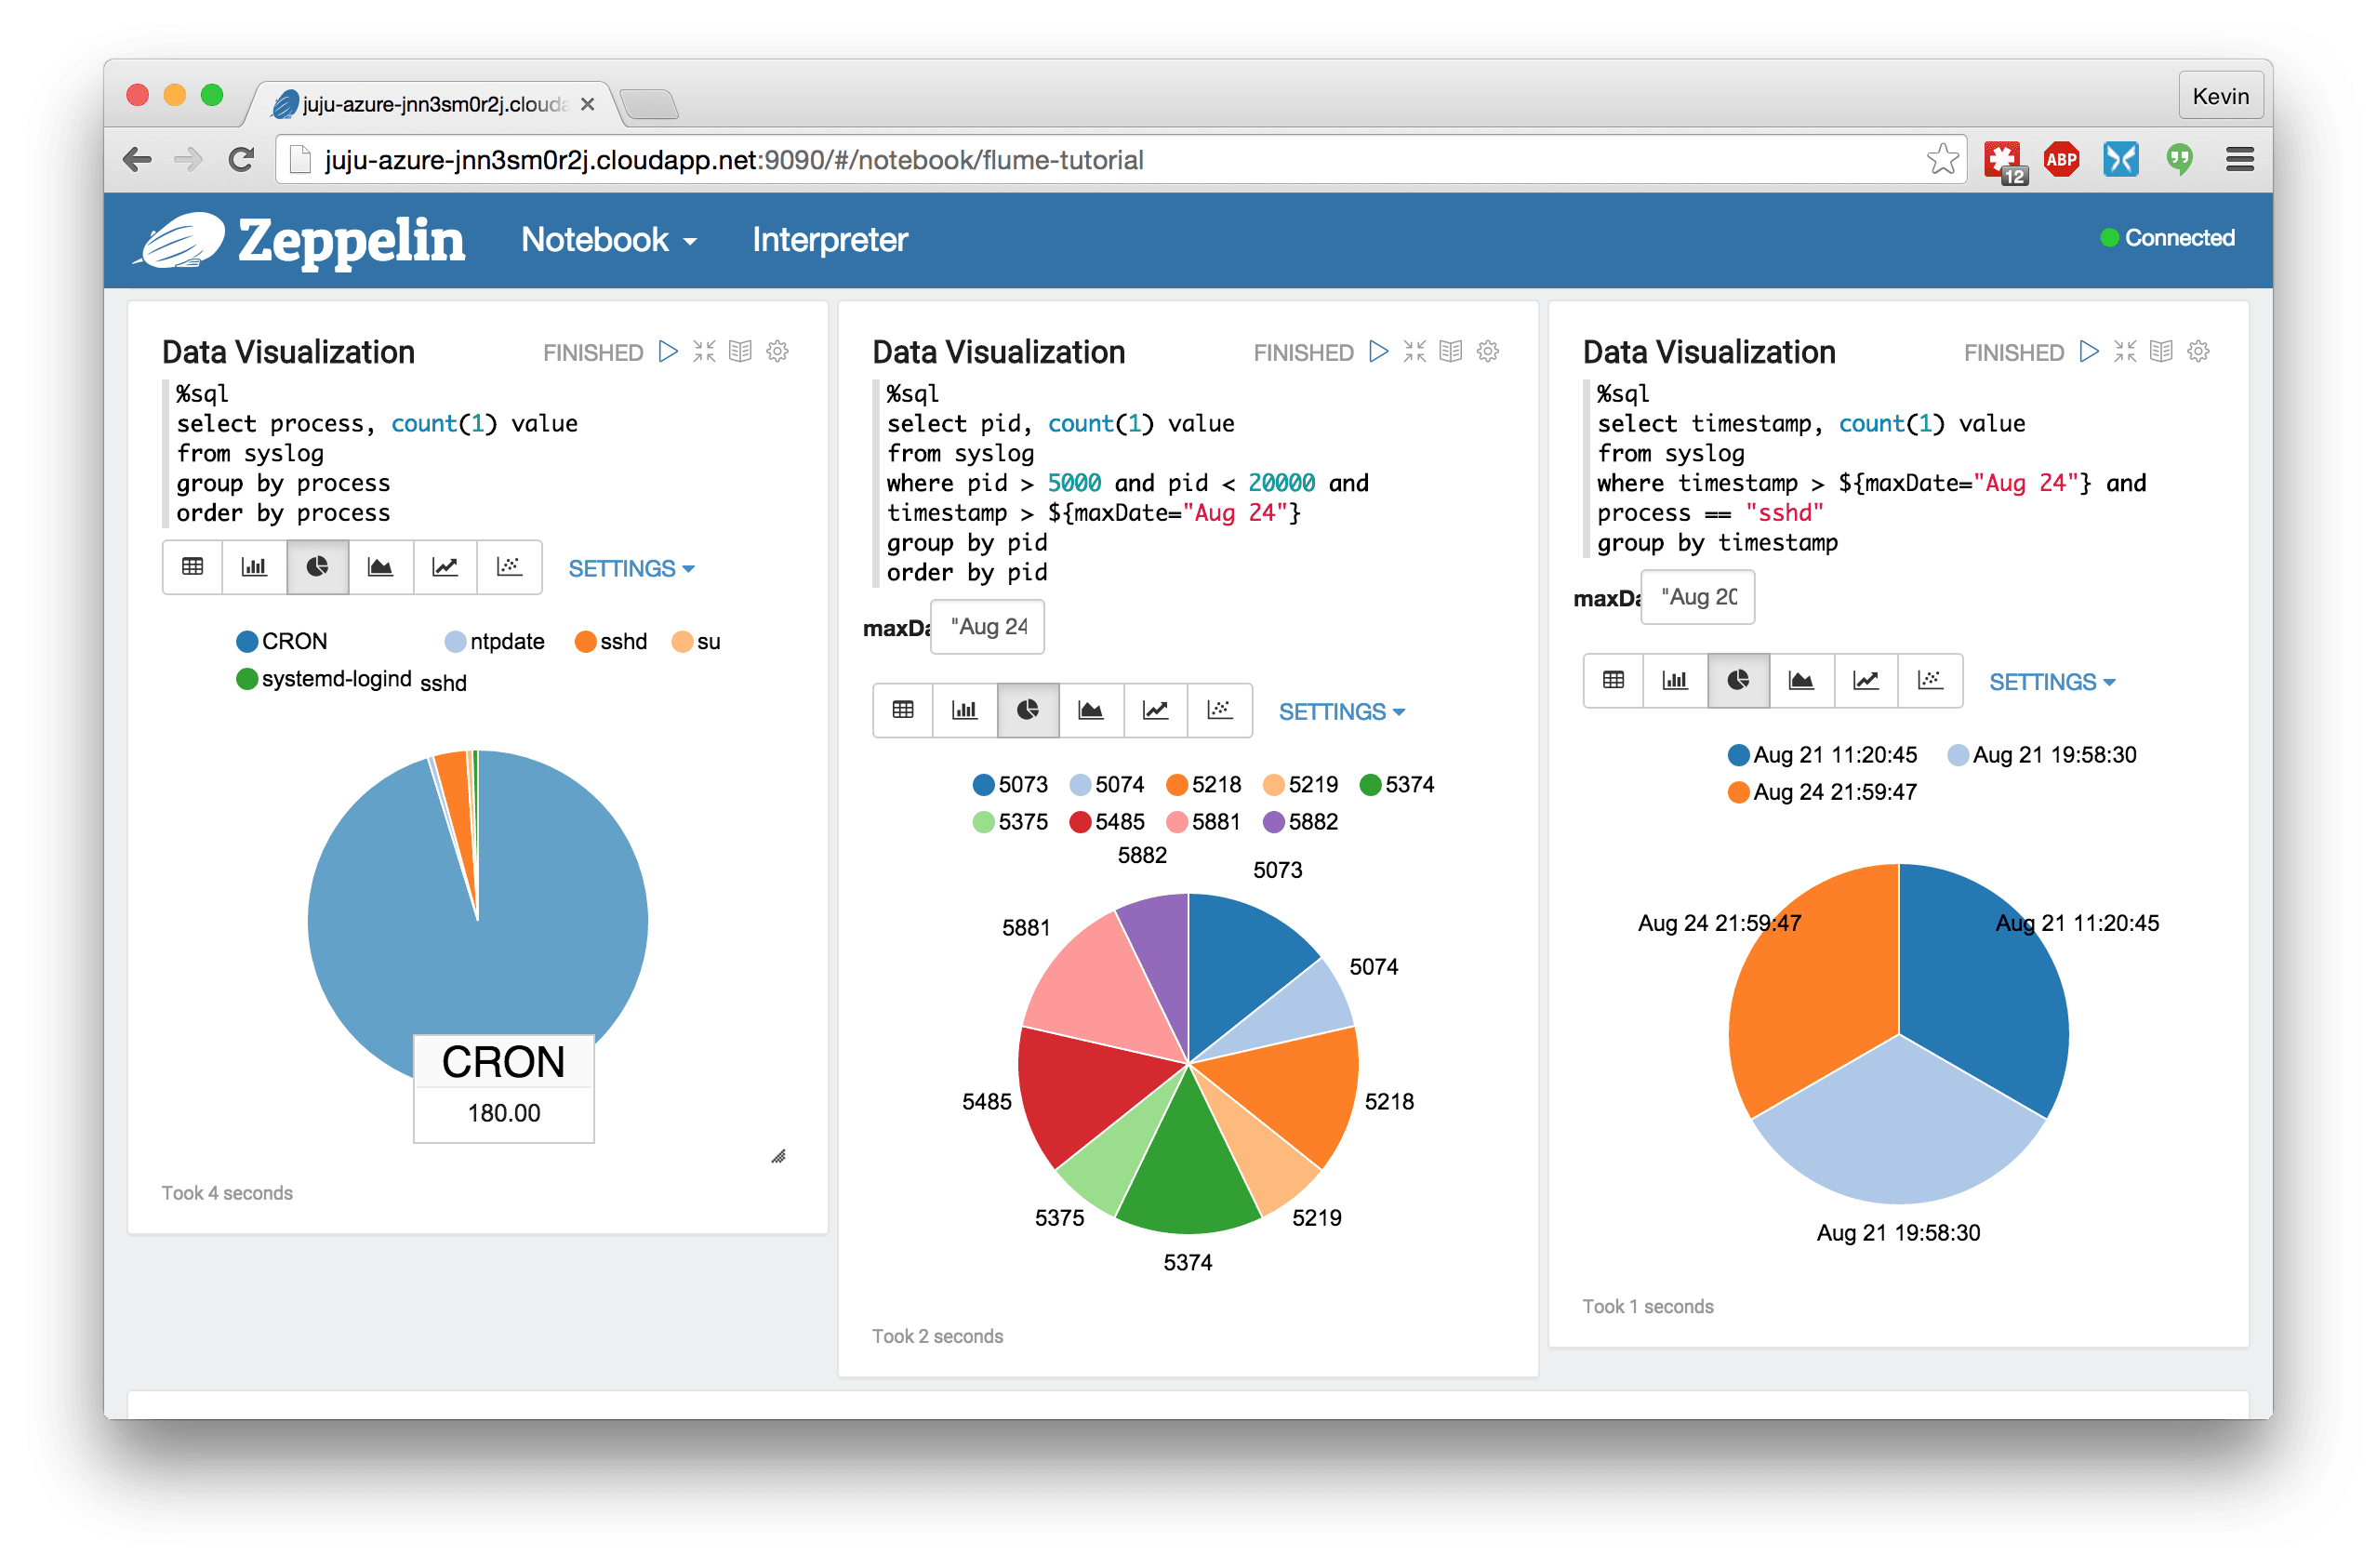
We’ve included another service that I haven’t mentioned yet: Apache Zeppelin. It’s a web-based notebook that offers a simple way to submit jobs and interact with your data using Spark (among other things). We provide a sample notebook in the Zeppelin charm to analyze the syslog events captured by this bundle. Once you have this deployed, see Zeppelin in action at http://<spark_unit_ip_address>:9090.
Note: You can find the Spark address in the juju status output seen above. Remember to juju expose Spark and Zeppelin if required for your environment.
This is ingestion, processing, and visualization in style:

Conclusion
I hope this has piqued your interest in some of the cool solutions we’re offering in the Big Data corner of the Juju ecosystem. We’re always interested in the Big Data problems you’re facing, so if you have questions/comments about this or any of our other bundles, reach out to us in #juju on irc.freenode.net.


