Galem KAYO
on 29 July 2019
Edge computing monitoring with Kubernetes
This blog demonstrates how to easily deploy monitoring tools at the edge using Kubernetes. In IoT scenarios, such a deployment brings the benefits of privacy, latency and minimal bandwidth cost.
Luckily, MicroK8s the single node Kubernetes, caters for such use cases. The beauty of MicroK8s is that deployment can be done in a couple of commands and in under a minute. MicroK8s can even fit on a Raspberry Pi. It is possible to build a monitoring stack on MicroK8s, deployable anywhere, even at the extreme edge. From a technical perspective, this simple solution is created using some of the popular open source components that are delivered out of the box with MicroK8s. These are:
- Grafana for the front-end analytics dashboard
- Prometheus for the back-end time-series database (ideal for sensor data)
To get up and running, follow these steps:
Installing MicroK8s, Grafana and Prometheus
First, install the MicroK8s snap
sudo snap install microk8s --classic
Once installed, it is possible to list all the add-ons that are delivered with MicroK8s.
microk8s.status
(alternatively)
microk8s.enable --help
None of the MicroK8s add-ons are enabled by default. Therefore Grafana and Prometheus will need to be enabled upon installation. Here is how to launch these applications:
microk8s.enable dashboard prometheus
There is no specific command to enable Grafana. It is launched automatically when the Kubernetes dashboard is enabled.
Accessing the Kubernetes dashboard
For the next steps, the kubectl command will be invoked. It is possible to alias this command because it is namespaced in Microk8s. This step is simple to reverse if it loses convenience.
sudo snap alias microk8s.kubectl kubectl
The access token for the Kubernetes dashboard can then be retrieved by invoking kubectl as shown below:
export TOKEN=$(kubectl describe secret $(kubectl get secret | awk '/^dashboard-token-/{print $1}') | awk '$1=="token:"{print $2}') && echo -e "\n--- Copy and paste this token for dashboard access --\n$TOKEN\n---"
To access the Kubernetes dashboard, it will be necessary to create a secure channel to the cluster with the command below:
kubectl proxy &
The dashboard will then be accessible at:
http://localhost:8001/api/v1/namespaces/kube-system/services/https:kubernetes-dashboard:/proxy/
Copying and pasting the token generated above will grant you access to the web based command interface to your cluster.
Accessing Grafana and Prometheus
As an initial step, we can confirm that Grafana and Prometheus are running on the cluster.
kubectl cluster-info
Once confirmed, you can view these services in the Kubernetes dashboard by selecting ‘monitoring’ under ‘Namespaces’, and then clicking ‘Services’. The list of monitoring services running on the cluster will then be displayed, along with the associated cluster IP addresses, internal endpoints and ports.
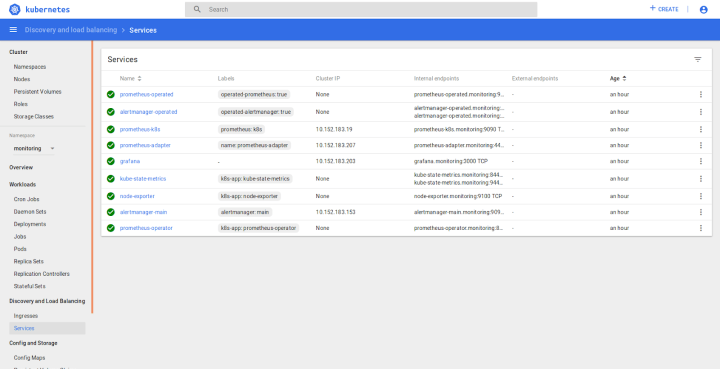
The Grafana and Prometheus UIs can then be simply accessed by entering the service IP and ports in the browser, according to the following format:
<cluster IP>:<port>
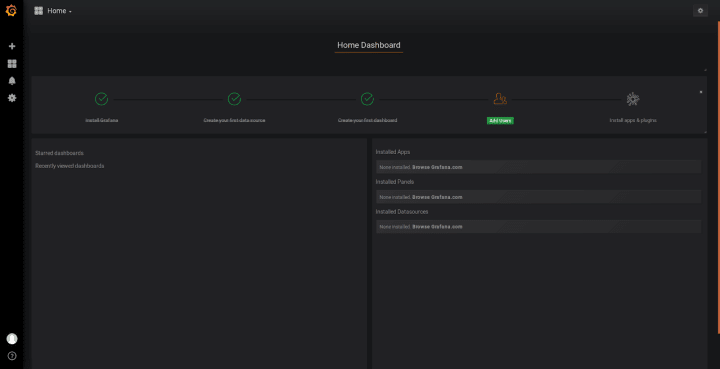
For Grafana, the username and password will be: admin/admin.
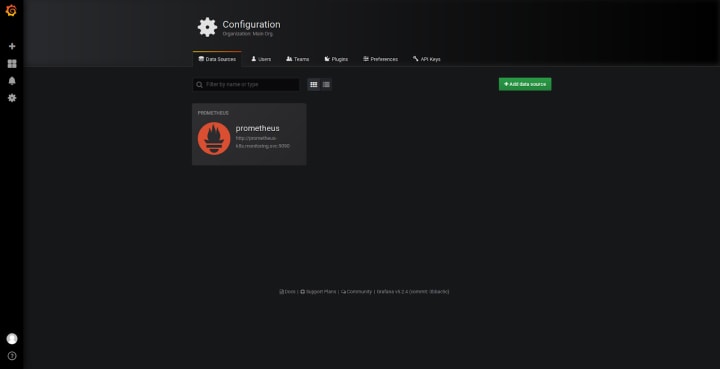
Grafana comes pre-configured with Prometheus as a data source.
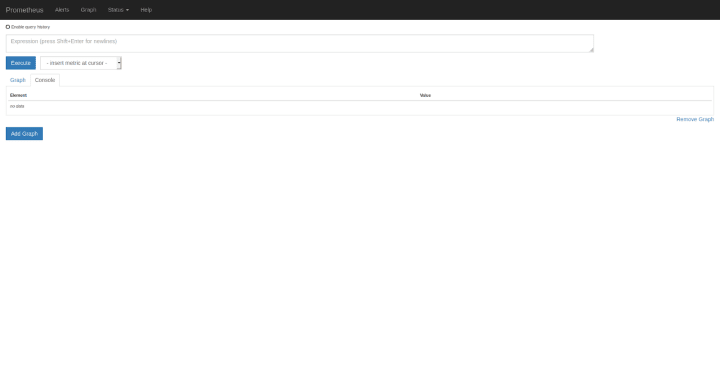
The Prometheus UI can be accessed in a similar manner. No username and password will be required.
Going further
Further to this easy setup, it is possible to feed sensor data to the Prometheus database. Prometheus has several client libraries for exporting sensor measurements. Additionally, panels and custom dashboards will be created in Grafana according to the metrics that are tracked for a particular use case.