
How to enable monitoring (COS)
All commands are written for juju >= v.3.1.7
Prerequisites
- A deployed Charmed OpenSearch operator
- A deployed
cos-litebundle in a Kubernetes environment
Summary
- Offer interfaces via the COS controller
- Consume offers via the OpenSearch model
- Deploy and integrate Grafana
- Connect to the Grafana web interface
Offer interfaces via the COS controller
First, we will switch to the COS K8s environment and offer COS interfaces to be cross-model integrated with the Charmed OpenSearch model.
To switch to the Kubernetes controller for the COS model, run
juju switch <k8s_cos_controller>:<cos_model_name>
To offer the COS interfaces, run
juju offer grafana:grafana-dashboard
juju offer loki:logging
juju offer prometheus:receive-remote-write
Consume offers via the OpenSearch model
Next, we will switch to the Charmed OpenSearch model, find offers, and consume them.
We are currently on the Kubernetes controller for the COS model. To switch to the OpenSearch model, run
juju switch <db_controller>:<opensearch_model_name>
To consume offers to be reachable in the current model, run
juju consume <k8s_cos_controller>:admin/cos.grafana
juju consume <k8s_cos_controller>:admin/cos.loki
juju consume <k8s_cos_controller>:admin/cos.prometheus
Deploy and integrate Grafana
First, deploy grafana-agent:
juju deploy grafana-agent
Then, integrate (previously known as “relate”) it with Charmed OpenSearch:
juju integrate grafana-agent grafana
juju integrate grafana-agent loki
juju integrate grafana-agent prometheus
Finally, integrate grafana-agent with consumed COS offers:
juju integrate grafana-agent-k8s opensearch:grafana-dashboard
juju integrate grafana-agent-k8s opensearch:logging
juju integrate grafana-agent-k8s opensearch:metrics-endpoint
After this is complete, Grafana will show the new dashboard Charmed OpenSearch and will allow access to Charmed OpenSearch logs on Loki.
Extend to Large Deployments
Large deployments run across multiple juju applications. Connect all the units of each application to grafana-agent, as explained above, and the dashboard will be able to summarize the entire cluster.
Connect Multiple Clusters
It is possible to have the same COS and dashboard for multiple deployments. The dashboard provides selectors to filter which cluster to watch at the time.
Connect to the Grafana web interface
To connect to the Grafana web interface, follow the Browse dashboards section of the MicroK8s “Getting started” guide.
juju run grafana/leader get-admin-password --model <k8s_cos_controller>:<cos_model_name>
Dashboard details
After accessing Grafana web interface, select the “Charmed OpenSearch” dashboard:
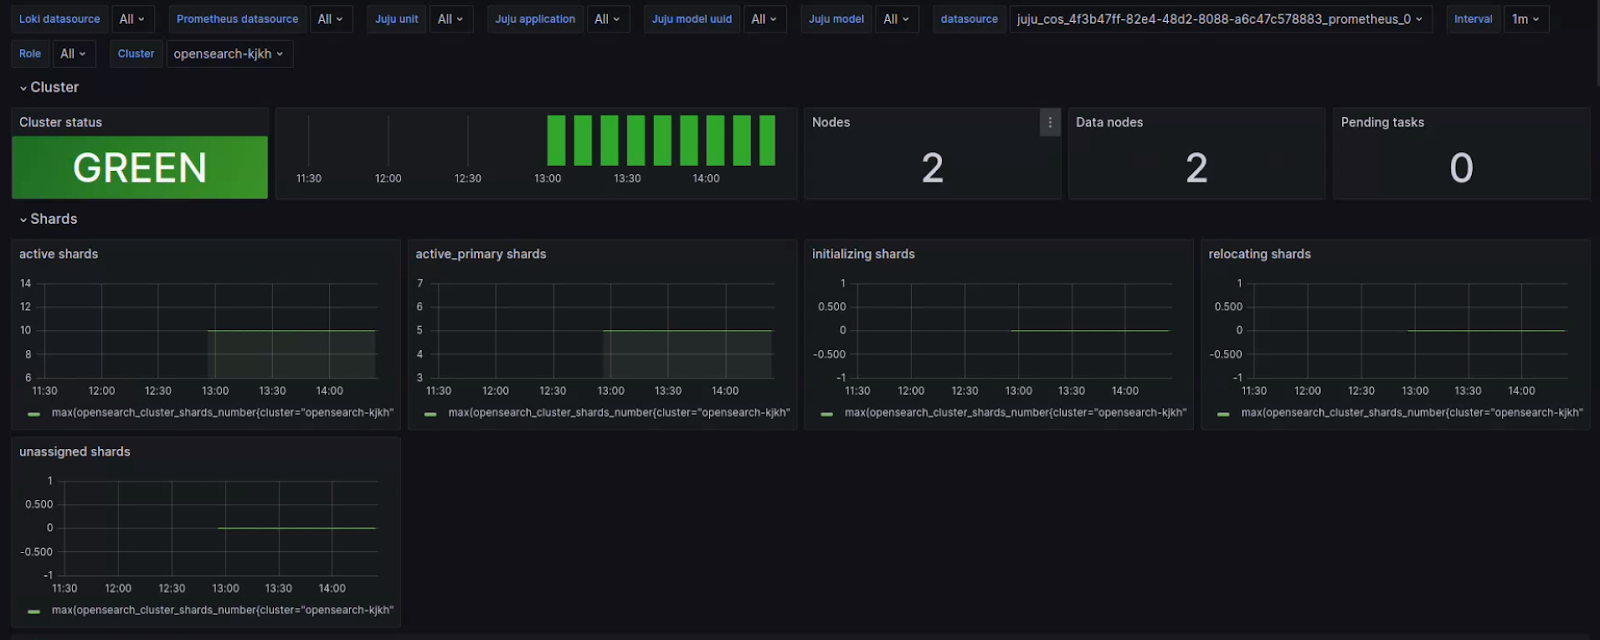
The dashboard filters for juju-specific elements, e.g. application name, unit, model; and also OpenSearch’s cluster and roles. The cluster dropdown allows to select which cluster we want to see the statistics from:
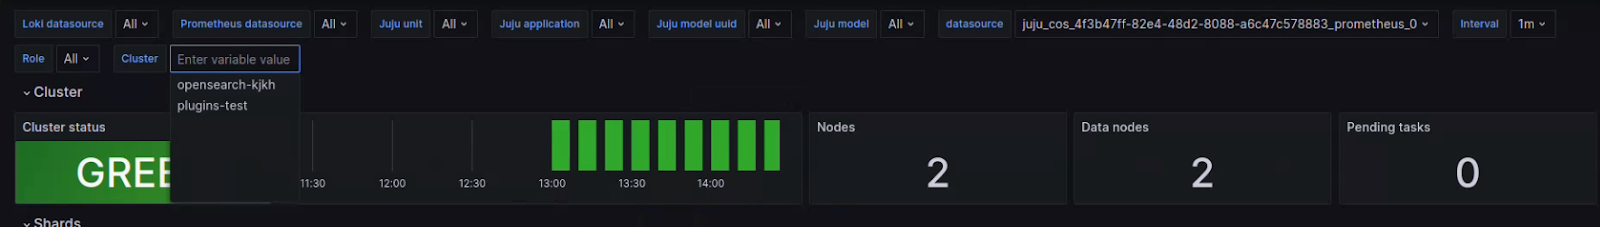
It is also possible to select a subset of nodes following roles. That can select nodes across models or applications as well.
