Marco Ceppi
on 17 August 2017
How to set up Kubernetes with conjure-up and monitor apps with Weave
On August 2, Luke Marsden (Weaveworks) and Marco Ceppi (Canonical) presented a webinar on how to Speed up your software development lifecycle with Kubernetes. In the session they described how you can use conjure-up and Weave Cloud to set up, manage and monitor an app in Kubernetes. In this tutorial we’re going to show you how to set up Kubernetes on any cloud, the conjure-up way. Once the cluster is spun up, you’ll use Weave Cloud to deploy an application, explore the microservices and monitor the app as it runs in the cluster.
Why Canonical & Weaveworks?
Canonical’s conjure-up makes it easy to deploy and operate Kubernetes in production, using a neat, easy-to-use CLI installer. Weave Cloud fills in the gaps missing with a Kubernetes install and provides the tools necessary for a full development lifecycle:
- Deploy – plug output of CI system into cluster so that you can ship features faster
- Explore – visualize and understand what’s happening so that you can fix problems faster
- Monitor – understand behavior of running system so that you can fix problems faster using Prometheus
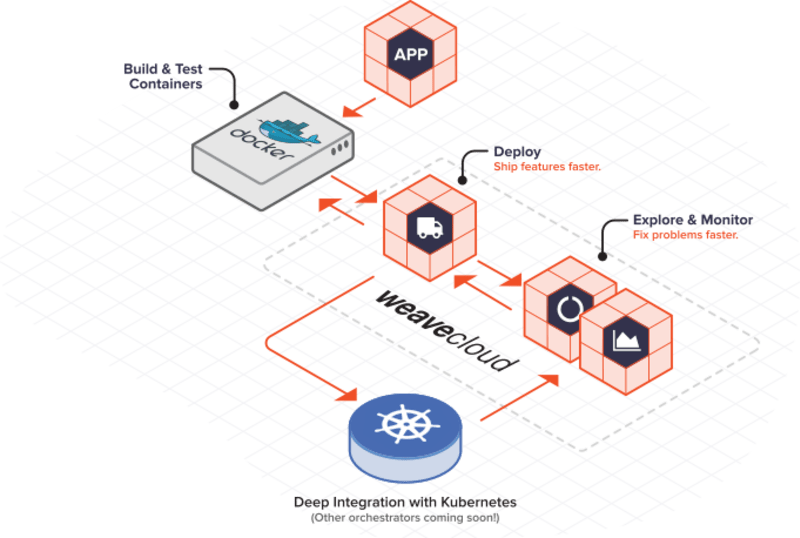
Weave Cloud Development Lifecycle
Installing Kubernetes with conjure-up
- Use conjure-up to install Kubernetes on your cloud infrastructure (LXD provider is not currently supported by Weave Cloud)
- Run the following script to enable privileged containers & set up RBAC properly:
juju config kubernetes-master allow-privileged=true
juju config kubernetes-worker allow-privileged=true
juju ssh kubernetes-master/0 -- 'sudo snap set kube-apiserver
authorization-mode=RBAC'
sleep 120
juju ssh kubernetes-master/0 -- '/snap/bin/kubectl create clusterrolebinding
root-cluster-admin-binding --clusterrole=cluster-admin --user=admin &&
/snap/bin/kubectl create clusterrolebinding kubelet-node-binding
--clusterrole=system:node --user=kubelet'
- Run
export KUBECONFIG=<path-to-kubeconfig>
find the path from e.g.
cat ~/bin/kubectl.conjure<tab>
You may wish to make this permanent by adding the export command to your ~/.bash_profile or equivalent shell startup script. Once you have the environment variable in place, you can run kubectl commands against the cluster. Try it out with
kubectl get nodes
Connecting your conjured up cluster to Weave Cloud
- Next you will visualize the Kubernetes cluster in Weave Cloud. Sign up for Weave Cloud. Select Setup → Kubernetes → Generic Kubernetes and then cut and paste the Kubernetes command from the Weave Cloud UI into your terminal:
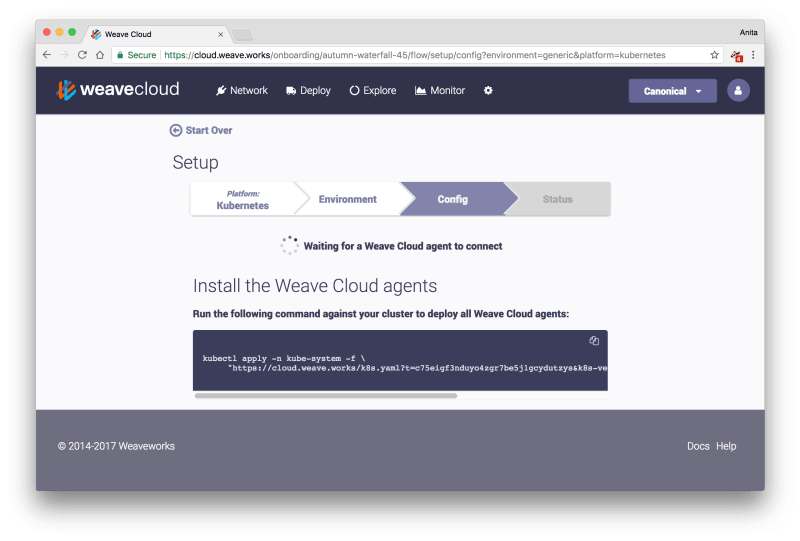
Weave Cloud Token and command location
For example, you would run:
kubectl apply -n kube-system -f \ "https://cloud.weave.works/k8s.yaml?t=[CLOUD-TOKEN]&k8s-version=$(kubectl version | base64 | tr -d '\n')"
Where,
- [CLOUD-TOKEN] is the Weave Cloud token.
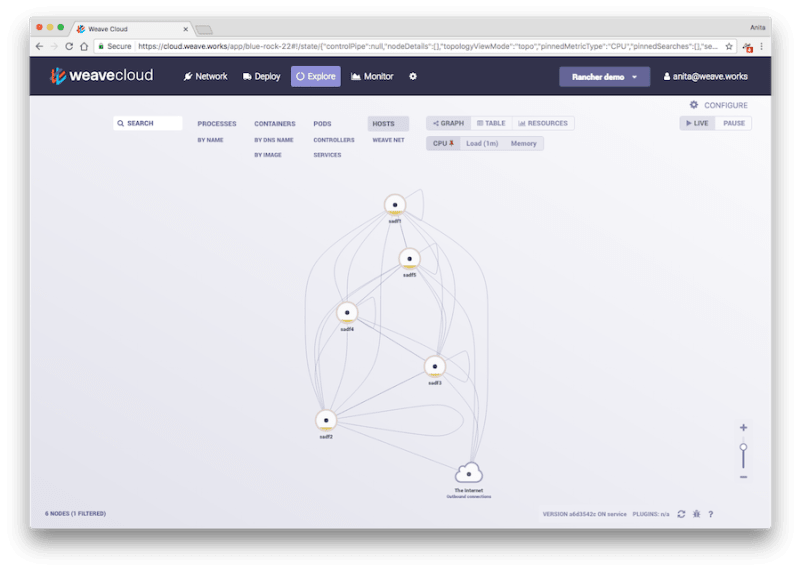
The cluster should now appear in Weave Cloud. Check Explore → Hosts to see all five hosts:
- Deploy the Sock Shop by first creating the namespace, checking it out of Git and then changing the kubernetes deploy directory:
kubectl create namespace sock-shop git clone https://github.com/microservices-demo/microservices-demo cd microservices-demo kubectl apply -n sock-shop -f deploy/kubernetes/manifests
Now you should be able to see the Sock Shop in Weave Cloud Explore (click Controllers and select the sock-shop namespace filter from the bottom left):
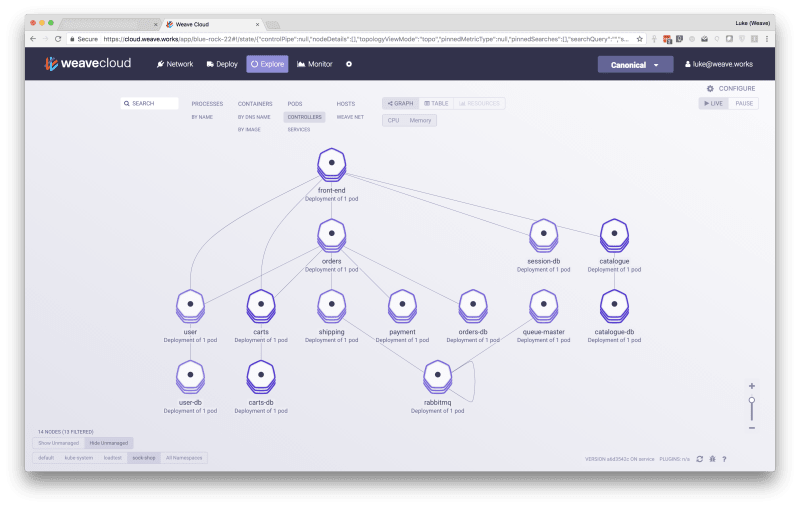
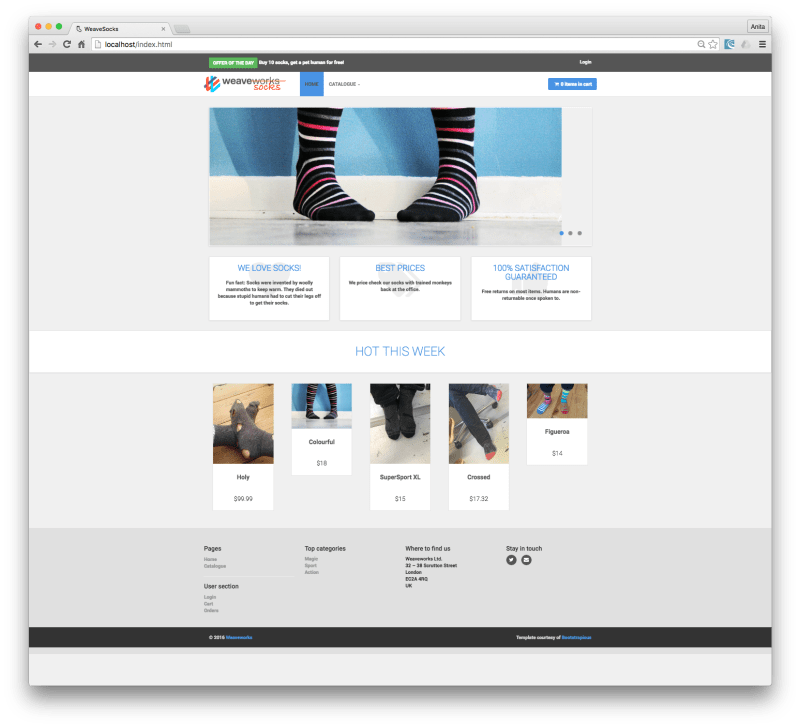
And you should be able to access the shop in your browser, using the IP address of one of your Kubernetes nodes at port :30001.
Once the app is loaded, try out the Monitoring tool in Weave Cloud to observe the latencies between services in the cluster. Click Monitor and then run the following query:
rate(request_duration_seconds_sum[1m])/rate(request_duration_seconds_count[1m])

You should see all the different requests latencies for all the services in the sock shop. This is possible because the sock shop is instrumented with the Prometheus client libraries.
Conclusion
In this post, we showed you how to get from nothing to a Kubernetes cluster using Canonical’s conjure-up. We then showed you how to install the Weave Cloud agents and just scratched the surface of what you can do with Weave Cloud: monitoring the request latencies on a Prometheus-instrumented app, the sock shop.
Next steps