lorumic
on 18 September 2023
WebRTC is an open-source technology that enables Real-Time Communications (RTC) in a web browser. It provides software developers with a set of application programming interfaces (APIs) to enable real-time data exchange between peers – e.g. for audio calls, video conferencing, or even game streaming. One of our products, Anbox Cloud, uses this technology to stream a session of an Android application running in the cloud to the Anbox Cloud web dashboard. Learn more about Anbox Cloud here.
Being peer-to-peer based, WebRTC does not need a server in the middle, which brings many benefits, like low latency, enhanced security, and a better stability. In general, what makes WebRTC great is that two users (peers) only need a web browser to establish a communication with each other.
More information on the technology can be found on the official WebRTC website.
The WebRTC Statistics API
One of the APIs we want to focus on in this post is the Statistics API. This essentially provides the developer with real-time information about the current connection between two peers. We will show how to display these statistics using ChartJS in a React application written in TypeScript.
WebRTC samples
The WebRTC samples page includes a collection of samples that demonstrate how the many APIs work. We will use these samples first to check some generic implementations of the WebRTC APIs, and then as a starting point to build our React app.
The demo “Stream from a video to a peer connection”, for example, can be a good starting point. In this example, we simulate two video peers exchanging data on the same web page. The sender video, on the left, sends video and audio data, and the receiver video, on the right, receives it using the WebRTC protocol.

However, this example does not show how to use the Statistics API. For that, we need to check another one, called “Constraints & statistics”. This example has some hardware requirements, because the two peers are exchanging data coming from a camera stream, so it is less generalisable than the previous example, which is a simple streaming of video files. We can take from this example only what we need, which is: the way the Statistics API is used.
This load of text data updated in real-time is not very user friendly. What about displaying this information through some nice graphs instead? That is where ChartJS, a powerful JavaScript charting library, comes in handy.

So, what we will do in the next steps of this tutorial is to stitch these two examples together in a React app, and then feed the data coming from the Statistics API to ChartJS, which allows us to display it through some nice graphs.
Bootstrapping the React application
We can use the create-react-app tool to bootstrap a React application and get started with development quickly. We can then customise the project, for example by switching the app bundler to Vite for a better development experience, but this is totally optional and will not be treated in detail here.
So, to bootstrap a React app in TypeScript we use the following command:
npx create-react-app my-app --template typescriptNote that you can find the full code for this tutorial in this repo. In order not to make the tutorial too long and complex, we will omit some steps, e.g. dependency installation, styling inside the App.css file, linter configuration, etc. Please clone the repo locally and start the project using npm start if you just want to see it running on your machine quickly, and then you can follow the rest of the tutorial to understand better what is going on in the code.
Adding a component with a sender video and a receiver video
Once created the
app, we can start adding our components to it. But even before that,
let’s add some types that we will need. We can create a types
folder and put these 2 files in it:
stats.d.ts– types for the stats, will be used later in the project
export interface StatsDataPoint {
  timestamp: number;
  value: number;
}

export interface GraphStat {
  dataPoints: StatsDataPoint[];
}

export type StatsHistory = Record<string, GraphStat>;

export interface GraphItem {
  title: string;
  unit?: string;
}

export interface Stats {
  video: {
    fps: number;
    bytesReceived: number;
    jitter: number;
    decodeTime: number;
    packetsReceived: number;
    packetsLost: number;
  };
  audio: {
    bytesReceived: number;
    jitter: number;
    totalSamplesReceived: number;
    packetsReceived: number;
    packetsLost: number;
  };
}video.d.ts– types for the video files:
declare module "*.webm" {
  const src: string;
  export default src;
}

declare module "*.mp4" {
  const src: string;
  export default src;
}
Let’s create an assets folder and copy into it the 2 video files from the WebRTC samples repo (chrome.mp4 and chrome.webm, but feel free to use any other video if you prefer).
Then, we can add a
WebRTCStats component that will be the general container of our
application.
const WebRTCStats: FC = () => {
  return <></>;
};

export default WebRTCStats;
Let’s now import and adapt some code from the first WebRTC sample we have seen above, which here goes in the body of our functional component:
interface HTMLVideoElementExtended extends HTMLVideoElement {
  captureStream?(): MediaStream;
  mozCaptureStream?(): MediaStream;
}

const WebRTCStats: FC = () => {
  const [stream, setStream] = useState<MediaStream>();
  const [senderPeer, setSenderPeer] = useState<RTCPeerConnection>();
  const [receiverPeer, setReceiverPeer] = useState<RTCPeerConnection>();
  const [isReceiverPlaying, setReceiverPlaying] = useState<boolean>(false);

  const senderVideoRef = useRef<HTMLVideoElementExtended>(null);
  const receiverVideoRef = useRef<HTMLVideoElementExtended>(null);

  const offerOptions: RTCOfferOptions = {
    offerToReceiveAudio: true,
    offerToReceiveVideo: true,
  };

  const maybeCreateStream = () => {
    if (!senderVideoRef.current) {
      return;
    }
    const senderVideo = senderVideoRef.current;
    if (senderVideo.captureStream) {
      setStream(senderVideo.captureStream());
      startPeerConnection();
    } else if (senderVideo.mozCaptureStream) {
      setStream(senderVideo.mozCaptureStream());
      startPeerConnection();
    } else {
      console.log("captureStream() not supported");
    }
  };

  const startPeerConnection = () => {
    setSenderPeer(new RTCPeerConnection());
    setReceiverPeer(new RTCPeerConnection());
  };

  useEffect(() => {
    if (senderPeer && receiverPeer && stream) {
      senderPeer.onicecandidate = (e) => onIceCandidate(senderPeer, e);

      receiverPeer.onicecandidate = (e) => onIceCandidate(receiverPeer, e);
      receiverPeer.ontrack = gotRemoteStream;

      stream.getTracks().forEach((track) => senderPeer.addTrack(track, stream));

      void senderPeer.createOffer(
        onCreateOfferSuccess,
        onCreateSessionDescriptionError,
        offerOptions,
      );
    }
  }, [senderPeer, receiverPeer]);

  const onIceCandidate = (
    pc: RTCPeerConnection,
    event: RTCPeerConnectionIceEvent,
  ) => {
    if (event.candidate) {
      if (senderPeer && receiverPeer) {
        void (pc === senderPeer ? receiverPeer : senderPeer).addIceCandidate(
          event.candidate,
        );
      }
    }
  };

  const gotRemoteStream = (event: RTCTrackEvent) => {
    const receiverVideo = receiverVideoRef.current;
    if (!receiverVideo) {
      return;
    }
    if (receiverVideo.srcObject !== event.streams[0]) {
      receiverVideo.srcObject = event.streams[0];
    }
  };

  const onCreateOfferSuccess = (desc: RTCSessionDescriptionInit) => {
    if (!senderPeer || !receiverPeer) {
      return;
    }
    void senderPeer.setLocalDescription(desc);
    void receiverPeer.setRemoteDescription(desc);
    void receiverPeer.createAnswer(
      onCreateAnswerSuccess,
      onCreateSessionDescriptionError,
    );
  };

  const onCreateSessionDescriptionError = (error: DOMException) => {
    console.log(`Failed to create session description: ${error.message}`);
  };

  const onCreateAnswerSuccess = (desc: RTCSessionDescriptionInit) => {
    if (!senderPeer || !receiverPeer) {
      return;
    }
    void receiverPeer.setLocalDescription(desc);
    void senderPeer.setRemoteDescription(desc);
  };

  useEffect(() => {
    if (senderVideoRef.current) {
      const senderVideo = senderVideoRef.current;
      // Video tag capture must be set up after video tracks are enumerated.
      senderVideo.oncanplay = maybeCreateStream;
      if (senderVideo.readyState >= 3) {
        // HAVE_FUTURE_DATA
        // Video is already ready to play, call maybeCreateStream in case oncanplay
        // fired before we registered the event handler.
        maybeCreateStream();
      }
      if (receiverVideoRef.current) {
        const receiverVideo = receiverVideoRef.current;
        receiverVideo.onplay = () => setReceiverPlaying(true);
        receiverVideo.onpause = () => setReceiverPlaying(false);
        senderVideo.onended = () => {
          receiverVideo.pause();
        };
      }
    }
  }, []);

  return <></>;
};

export default WebRTCStats;
We had to make some adjustments due to the fact that we are using TypeScript here, not JavaScript. Apart from that, it is the same code that one can find in the main.js file of the video-pc example in the repo.
Now we should add the elements that the FC should return:
  return (
    <>
      <h1>WebRTC Stats + ChartJS React example</h1>
      <h2>WebRTC Peers</h2>
      <div className="peers-container">
        <div className="video-container">
          <h3>Sender video</h3>
          <video ref={senderVideoRef} playsInline controls>
            <source src={chromeWebm} type="video/webm" />
            <source src={chromeMp4} type="video/mp4" />
            <p>This browser does not support the video element.</p>
          </video>
        </div>

        <div className="video-container">
          <h3>Receiver video</h3>
          <video ref={receiverVideoRef} playsInline controls />
        </div>
      </div>
    </>
  );
Let’s now open App.tsx and replace the code there with the following:
const App: FC = () => {
  return (
    <div className="App">
      <WebRTCStats />
    </div>
  );
};

export default App;
With this, we get the two videos in our page:
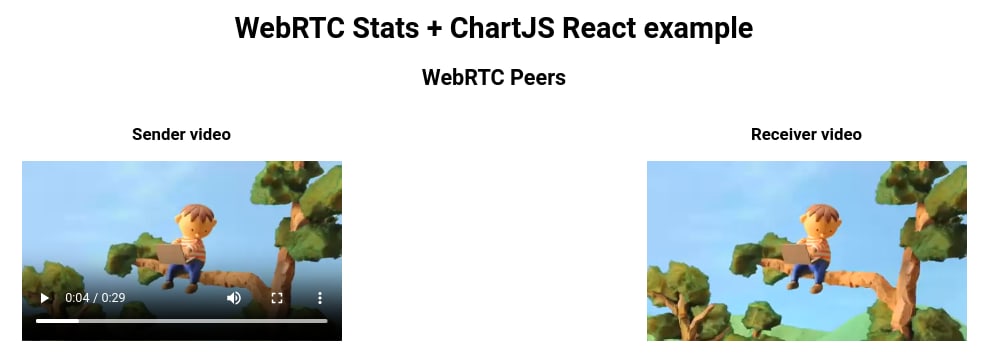
We can play both videos and see that the data streamed in the sender video gets correctly displayed by the receiver one. So far so good.
Adding helper functions, hooks and context for statistics
Let’s now focus on adding a proper way to handle the statistics once we receive them from the Statistics API. First, we can add a new file with some helper functions for the statistics that we are interested in:
export const STATS_SECTIONS = {
  video: "Video",
  audio: "Audio",
};

export const statSectionsMap = new Map(Object.entries(STATS_SECTIONS));

export const STATS_LABELS = {
  bytesReceived: "Data received",
  fps: "FPS",
  decodeTime: "Decode time",
  jitter: "Jitter",
  packetsReceived: "Packets received",
  packetsLost: "Packets lost",
  totalSamplesReceived: "Total samples received",
};

export const statsLabelsMap = new Map(Object.entries(STATS_LABELS));

export const STATS_UNITS: Record<string, string> = {
  mB: "MB",
  ms: "ms",
  fps: "FPS",
  packets: "packets",
};

export const MB_STATS = ["video-datareceived", "audio-datareceived"];

export const MS_STATS = ["video-decodetime", "video-jitter", "audio-jitter"];

export const formatMb = (v: number) => {
  return +(v / 1000 / 1000).toFixed(2);
};

export const formatMs = (v: number) => {
  return +(v * 1000).toFixed(2);
};

export const formatValue = (value: number, unit?: string) => {
  switch (unit) {
    case STATS_UNITS.mB:
      return formatMb(value);
    case STATS_UNITS.ms:
      return formatMs(value);
    default:
      return value;
  }
};

export const getUnitFromGraphId = (graphId: string) => {
  if (MB_STATS.includes(graphId)) {
    return STATS_UNITS.mB;
  } else if (MS_STATS.includes(graphId)) {
    return STATS_UNITS.ms;
  }
};

export const getFormattedValueFromGraphId = (
  graphId: string,
  value: number,
) => {
  const unit = getUnitFromGraphId(graphId);
  return formatValue(value, unit);
};

export const graphTitleToId = (title: string) => {
  return title.toLowerCase().replace(/ /g, "");
};

export const sectionAndNameToId = (section: string, name: string) => {
  return graphTitleToId(`${section}-${name}`);
};
These will be used in many places. Let’s also create a Context that we can share between components to handle some common operations on the data object that is used to collect and update the stats:
export const STATS_TIME_WINDOW = 5 * 60 * 1000; // ms (5 minutes)
export const STATS_UPDATE_INTERVAL = 3000; // ms

interface StatsContextProps {
  statsHistory: StatsHistory;
  updateStats: (newStats: Stats) => void;
  resetStatsHistory: () => void;
}

const initialState: StatsContextProps = {
  statsHistory: {},
  updateStats: () => undefined,
  resetStatsHistory: () => undefined,
};

export const StatsContext = createContext<StatsContextProps>(initialState);

interface StatsProviderProps {
  children: ReactNode;
}

const StatsProvider: FC<StatsProviderProps> = ({ children }) => {
  const [statsHistory, setStatsHistory] = useState<StatsHistory>({});
  const [statsVersion, setStatsVersion] = useState(0);

  const resetStatsHistory = () => {
    setStatsHistory({});
  };

  const updateStats = (newStats: Stats) => {
    const now = Date.now();
    const discardThreshold = now - STATS_TIME_WINDOW;

    Object.entries(newStats).forEach(([statSectionKey, statSectionValue]) => {
      Object.entries(statSectionValue).forEach(([statKey, statValue]) => {
        const section = statSectionsMap.get(statSectionKey) ?? "";
        const name = statsLabelsMap.get(statKey) ?? "";
        if (!section || !name) {
          return;
        }
        const graphId = sectionAndNameToId(section, name);

        if (!(graphId in statsHistory)) {
          statsHistory[graphId] = {
            dataPoints: [],
          };
        }

        statsHistory[graphId].dataPoints.push({
          timestamp: now,
          value: getFormattedValueFromGraphId(graphId, statValue as number),
        });

        statsHistory[graphId].dataPoints = statsHistory[
          graphId
        ].dataPoints.filter(
          (dataPoint) => dataPoint.timestamp > discardThreshold,
        );
      });
    });

    if (now > statsVersion + STATS_UPDATE_INTERVAL) {
      setStatsVersion(now);
    }
  };

  return (
    <StatsContext.Provider
      value={{
        statsHistory,
        updateStats,
        resetStatsHistory,
      }}
    >
      {children}
    </StatsContext.Provider>
  );
};

export default StatsProvider;
And then we simply provide access to the return value of the Context with a hook:
export default function useStats() {
  return useContext(StatsContext);
}
We can now wrap the
StatsProvider around the WebRTCStats component in the App.tsx file:
const App: FC = () => {
  return (
    <div className="App">
      <StatsProvider>
        <WebRTCStats />
      </StatsProvider>
    </div>
  );
};
Function-wise,
nothing has changed in our app yet, because we have just set up a
mechanism to parse the stats. Now we need to add a component that
calls the updateStats function in the Context to add the new values
that we poll from the Statistics API.
Adding a wrapper component for statistics
Let’s create a new
component, naming it e.g. StatsGraphs. This will be the general
wrapper for the single graph components, but more importantly, it
will poll the Statistics API periodically to get fresh data using
setInterval, as shown in the second WebRTC sample above.
interface Props {
  targetPeer: RTCPeerConnection;
  isPlaying: boolean;
}

const StatsGraphs: FC<Props> = ({ targetPeer, isPlaying }) => {
  const { updateStats } = useStats();

  setInterval(() => {
    if (isPlaying) {
      targetPeer.getStats(null).then(onStatsUpdate, (err) => console.log(err));
    }
  }, STATS_UPDATE_INTERVAL);

  const onStatsUpdate = (statsReport: RTCStatsReport) => {
    const stats = {} as Stats;
    statsReport.forEach((report) => {
      if (report.type !== "inbound-rtp") {
        return;
      }
      if (report.kind === "video") {
        stats.video = {
          fps: report.framesPerSecond,
          bytesReceived: report.bytesReceived,
          jitter: report.jitter,
          decodeTime: report.totalDecodeTime,
          packetsReceived: report.packetsReceived,
          packetsLost: report.packetsLost,
        };
      }
      if (report.kind === "audio") {
        stats.audio = {
          bytesReceived: report.bytesReceived,
          jitter: report.jitter,
          totalSamplesReceived: report.totalSamplesReceived,
          packetsReceived: report.packetsReceived,
          packetsLost: report.packetsLost,
        };
      }
    });
    updateStats(stats);
  };

  return <></>;
};

export default StatsGraphs;
You can see that we
basically created a function that extracts only the data that we care
about from the RTCStatsReport map. We parse this data using the Stats
type that we created before, and then send it to our Context function
to add the latest set of stats that we just received.
Adding a component for the graph and chaining all together
We have now reached the leaf of our component tree – the graph component. In this component, we will finally use ChartJS (for which we need some dependencies to be installed, check the package.json file) to display some graphs. Here is the code for it:
interface Props {
  item: GraphItem;
}

const StatsGraph: FC<Props> = ({ item }: Props) => {
  const { statsHistory } = useStats();

  const chartRef: MutableRefObject<ChartJS<
    "line",
    number[],
    number | undefined
  > | null> = useRef(null);

  const graphId = graphTitleToId(item.title);
  if (!(graphId in statsHistory)) {
    return null;
  }
  const dataPoints = statsHistory[graphId].dataPoints;
  const values = dataPoints.map((dataPoint) => dataPoint.value);

  const now = Date.now();

  const graphOptions = {
    animation: {
      duration: 0,
    },
    borderColor: "rgb(15, 149, 161)",
    interaction: {
      intersect: false,
      mode: "index",
    },
    maintainAspectRatio: false,
    plugins: {
      tooltip: {
        callbacks: {
          label: (context: TooltipItem<"line">) => {
            return `${item.title}: ${context.parsed.y}${
              item.unit ? ` ${item.unit}` : ""
            }`;
          },
        },
        displayColors: false,
      },
    },
    responsive: true,
    scales: {
      x: {
        min: now - STATS_TIME_WINDOW,
        max: now,
        ticks: {
          autoSkipPadding: 15,
          maxRotation: 0,
        },
        time: {
          unit: "minute",
        },
        type: "time",
      },
      y: {
        ticks: {
          callback: (value: number, _index: number, ticks: Tick[]) => {
            if (value < 0) {
              return null;
            }

            if (values.every(isInteger)) {
              return isInteger(value) || ticks.length === 1
                ? Math.round(value)
                : null;
            }

            return Math.round((value + Number.EPSILON) * 100) / 100;
          },
        },
        title: {
          display: Boolean(item.unit),
          text: item.unit,
        },
      },
    },
  };

  ChartJS.register(TimeScale, LinearScale, PointElement, LineElement, Tooltip);

  return (
    <div>
      {item.title}
      <div className="graph-wrapper">
        <Line
          ref={chartRef}
          className="graph-canvas"
          options={graphOptions}
          datasetIdKey={item.title}
          data={{
            labels: dataPoints.map((dataPoint) => dataPoint.timestamp),
            datasets: [
              {
                data: values,
                pointRadius: 1,
              },
            ],
          }}
        />
      </div>
    </div>
  );
};

export default StatsGraph;
It is important to
note that we use the GraphItem title to build the key (graphId) to
extract the data from the statsHistory object stored in the Context.
Keeping this in mind, we can add a return to the parent, the
StatsGraphs component, as follows:
  return (
    <>
      {isPlaying ? (
        <>
          <h3>Video</h3>
          <div className="graphs-row">
            <StatsGraph
              item={{ title: "Video - Data received", unit: STATS_UNITS.mB }}
            />
            <StatsGraph
              item={{ title: "Video - Jitter", unit: STATS_UNITS.ms }}
            />
            <StatsGraph
              item={{ title: "Video - FPS", unit: STATS_UNITS.fps }}
            />
          </div>
          <h3>Audio</h3>
          <div className="graphs-row">
            <StatsGraph
              item={{ title: "Audio - Data received", unit: STATS_UNITS.mB }}
            />
            <StatsGraph
              item={{ title: "Audio - Jitter", unit: STATS_UNITS.ms }}
            />
            <StatsGraph item={{ title: "Audio - Total samples received" }} />
          </div>
        </>
      ) : (
        <>Hit the play button on both videos to see some stats graphs</>
      )}
    </>
  );
Let’s now modify
the return block for the WebRTCStats component, so that it contains
also the StatsGraphs component:
return (
<>
<h1>WebRTC Stats + ChartJS React example</h1>
<h2>WebRTC Peers</h2>
<div className="peers-container">
<div className="video-container">
<h3>Sender video</h3>
<video ref={senderVideoRef} playsInline controls>
<source src={chromeWebm} type="video/webm" />
<source src={chromeMp4} type="video/mp4" />
<p>This browser does not support the video element.</p>
</video>
</div>
<div className="video-container">
<h3>Receiver video</h3>
<video ref={receiverVideoRef} playsInline controls />
</div>
</div>
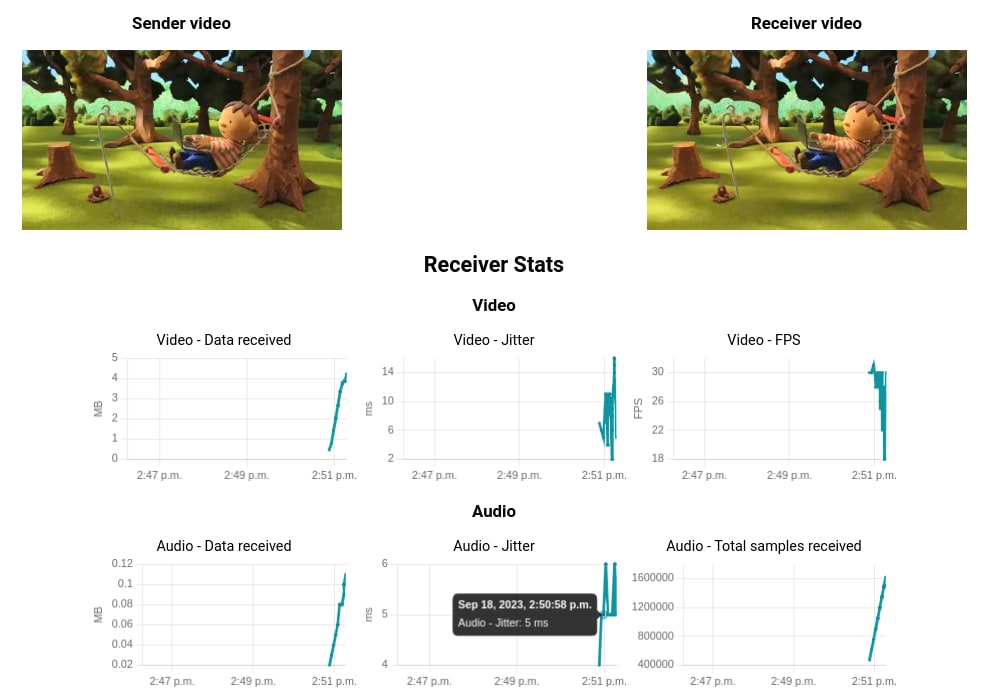
<h2>Receiver Stats</h2>
{receiverPeer ? (
<StatsGraphs targetPeer={receiverPeer} isPlaying={isReceiverPlaying} />
) : (
<p>Receiver peer not connected.</p>
)}
</>
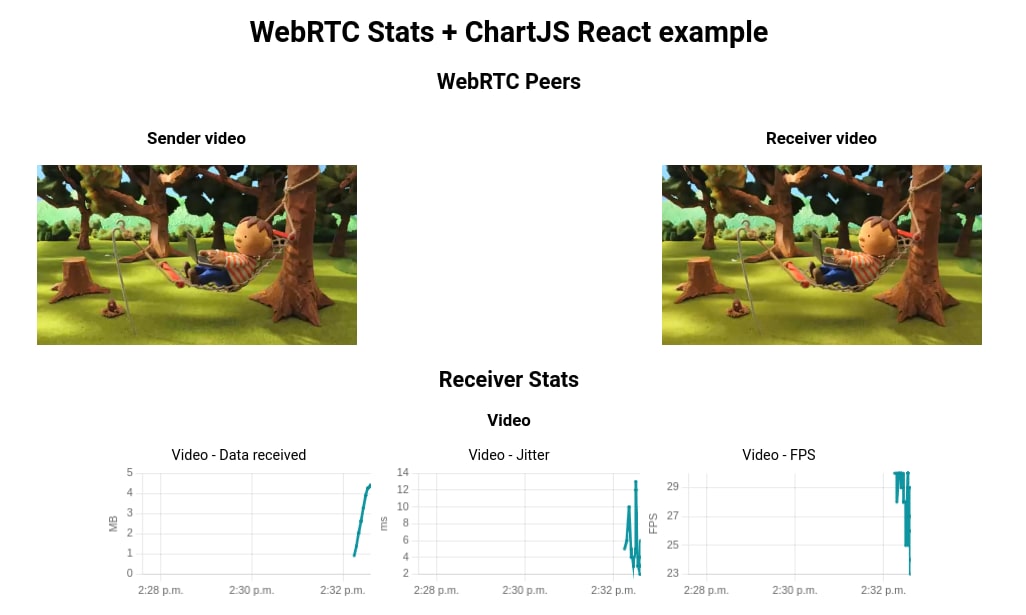
);With this in place,
the app is ready. When we hit the play button on both videos, the
stats will start showing after a few seconds, and get updated
periodically. With the configuration that we passed to ChartJS
(graphOptions object in the StatsGraph component), we have also set
up a custom hover behaviour that will display detailed information
when we hover over a single data point.
Wrapping up
In this tutorial, we have seen how to display some nice graphs using the data provided by the WebRTC Statistics API. The hope is that, after reading this, you are more familiar with WebRTC, its Statistics API, JS-based data visualisation tools like ChartJS and how they can be baked into a React application written in TypeScript.