How to enable monitoring


To enable monitoring and observability, COS
In this guide, we’ll refer to the following:
<cos_k8s_controller>is a Kubernetes Juju controller<cos_model>is the Juju model where the COS lite bundle is deployed
<postgresql_controller>is a VM or Kubernetes Juju controller, depending on which substrate you have PostgreSQL deployed on<postgresql_model>is the Juju model where PostgreSQL is deployed
Prerequisites
The
cos-litebundle deployed in a Kubernetes environment
Offer interfaces via the COS controller
First, we will switch to the COS K8s environment and offer COS interfaces to be cross-model integrated with the model hosting Charmed PostgreSQL.
To switch to the Kubernetes controller for the COS model, run
juju switch <cos_k8s_controller>:<cos_model>
To offer the COS interfaces, run
juju offer grafana:grafana-dashboard
juju offer loki:logging
juju offer prometheus:receive-remote-write
Consume offers via the PostgreSQL model
Next, we will switch to the Charmed PostgreSQL model, find offers, and consume them.
We are currently on the Kubernetes controller for the COS model. To switch to the PostgreSQL model, run
juju switch <postgresql_controller>:<postgresql_model>
To find offers, run the following command (make sure not to miss the “:” at the end!):
juju find-offers <cos_k8s_controller>:
The output should be similar to the sample below:
Store                 URL                            Access  Interfaces
<cos_k8s_controller>  admin/<cos_model>:grafana      admin   grafana:grafana-dashboard
<cos_k8s_controller>  admin/<cos_model>.loki         admin   loki:logging
<cos_k8s_controller>  admin/<cos_model>.prometheus   admin   prometheus:receive-remote-write
...
To consume offers to be reachable in the current model, run
juju consume <cos_k8s_controller>:admin/<cos_model>.grafana
juju consume <cos_k8s_controller>:admin/<cos_model>.loki
juju consume <cos_k8s_controller>:admin/<cos_model>.prometheus
Deploy and integrate Grafana
In the PostgreSQL model, deploy the grafana-agent or grafana-agent-k8s charm:
juju deploy grafana-agent
juju deploy grafana-agent-k8s --trust
Then, integrate it with Charmed PostgreSQL:
juju integrate postgresql:cos-agent grafana-agent
juju integrate grafana-agent-k8s grafana
juju integrate grafana-agent-k8s loki
juju integrate grafana-agent-k8s prometheus
Finally, integrate the Grafana agent with consumed COS offers:
juju integrate grafana-agent grafana
juju integrate grafana-agent loki
juju integrate grafana-agent prometheus
juju integrate grafana-agent-k8s postgresql-k8s:grafana-dashboard
juju integrate grafana-agent-k8s postgresql-k8s:logging
juju integrate grafana-agent-k8s postgresql-k8s:metrics-endpoint
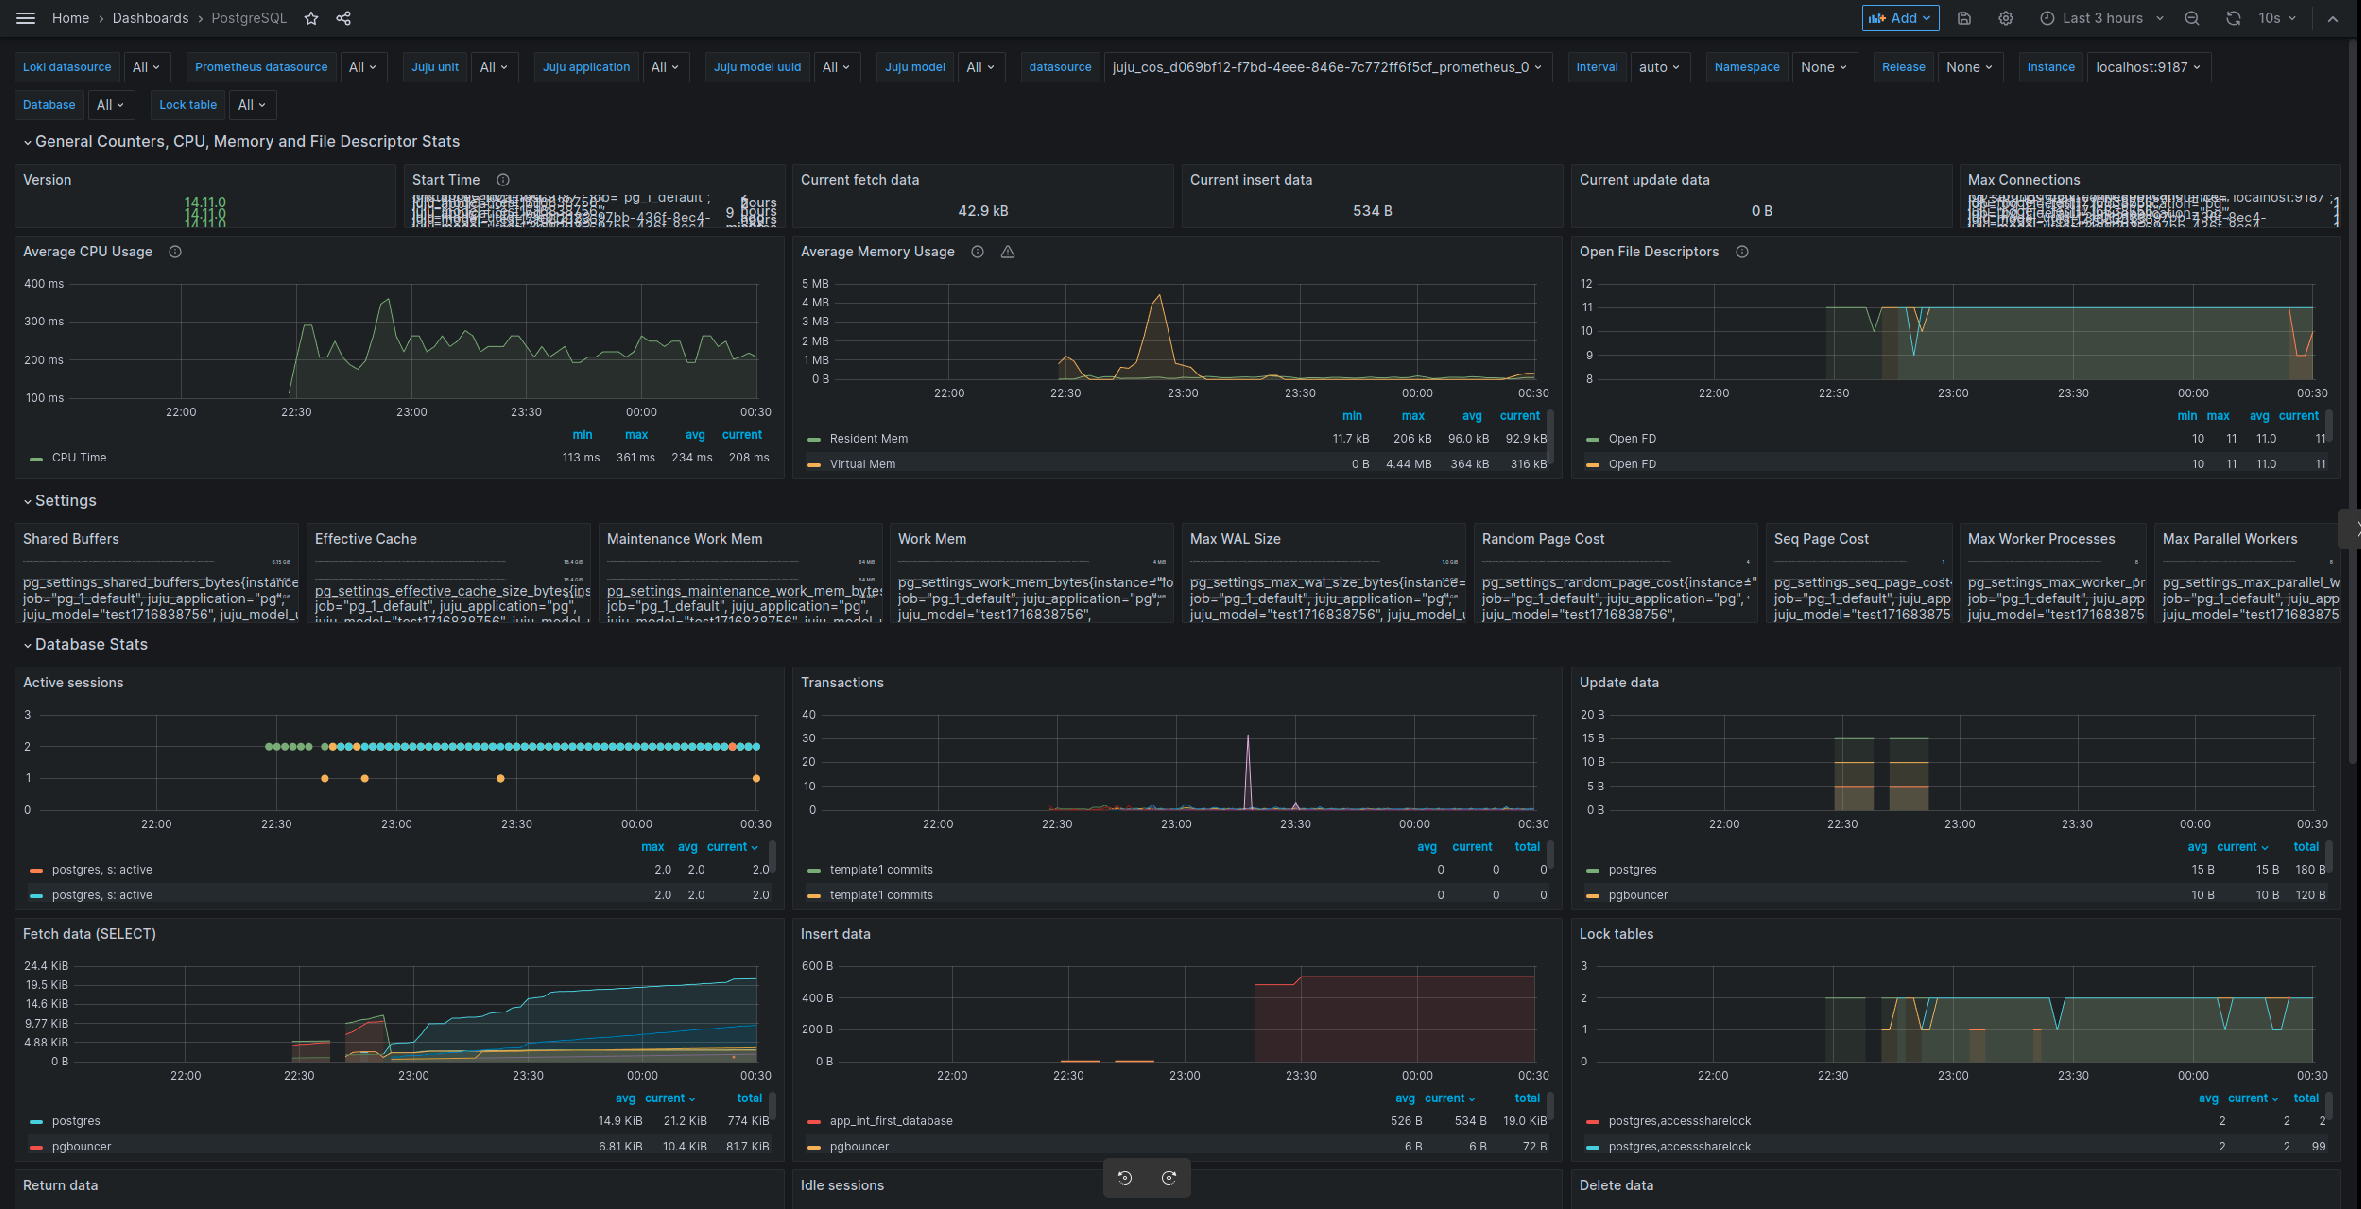
After this is complete, Grafana will show the new dashboard PostgreSQL Exporter and will allow access to Charmed PostgreSQL logs on Loki.
Sample outputs
Below is a sample output of juju status on the PostgreSQL model:
Model                Controller  Cloud/Region         Version  SLA          Timestamp
sample-psql-model    local       localhost/localhost  3.1.6    unsupported  00:12:18+02:00

SAAS           Status  Store    URL
grafana        active  k8s      admin/cos.grafana-dashboards
loki           active  k8s      admin/cos.loki-logging
prometheus     active  k8s      admin/cos.prometheus-receive-remote-write

App                   Version      Status  Scale  Charm               Channel    Rev  Exposed  Message
grafana-agent                      active      1  grafana-agent       edge         5  no
postgresql              16.9       active      1  postgresql          16/stable  296  no       Primary

Unit                          Workload  Agent  Machine  Public address  Ports               Message
postgresql/3*                 active    idle   4        10.85.186.140                       Primary
grafana-agent/0*              active    idle            10.85.186.140

Machine  State    Address        Inst id        Series  AZ  Message
4        started  10.85.186.140  juju-fcde9e-4  jammy       Running
Model              Controller  Cloud/Region        Version  SLA          Timestamp
sample-psql-model  microk8s    microk8s/localhost  3.1.6    unsupported  00:21:41+02:00

SAAS        Status  Store     URL
grafana     active  microk8s  admin/cos.grafana
loki        active  microk8s  admin/cos.loki
prometheus  active  microk8s  admin/cos.prometheus

App                Version  Status  Scale  Charm              Channel  Rev  Address          Exposed  Message
grafana-agent-k8s  0.32.1   active      1  grafana-agent-k8s  stable    42  10.152.183.61    no
postgresql-k8s     16.9     active      3  postgresql-k8s     16/stable  615  10.152.183.126 no

Unit                  Workload  Agent   Address       Ports  Message
grafana-agent-k8s/0*  active    idle    10.1.142.191
postgresql-k8s/0      active    idle    10.1.142.171
postgresql-k8s/1      active    idle    10.1.142.169
postgresql-k8s/2*     active    idle    10.1.142.170         Primary
Below is a sample output of juju status on the COS K8s model:
Model               Controller   Cloud/Region        Version  SLA          Timestamp
sample-cos-model    k8s          microk8s/localhost  3.1.6    unsupported  00:15:31+02:00

App           Version  Status  Scale  Charm             Channel  Rev  Address         Exposed  Message
alertmanager  0.23.0   active      1  alertmanager-k8s  stable    47  10.152.183.206  no
catalogue              active      1  catalogue-k8s     stable    13  10.152.183.183  no
grafana       9.2.1    active      1  grafana-k8s       stable    64  10.152.183.140  no
loki          2.4.1    active      1  loki-k8s          stable    60  10.152.183.241  no
prometheus    2.33.5   active      1  prometheus-k8s    stable   103  10.152.183.240  no
traefik       2.9.6    active      1  traefik-k8s       stable   110  10.76.203.178   no

Unit             Workload  Agent  Address      Ports  Message
alertmanager/0*  active    idle   10.1.84.125
catalogue/0*     active    idle   10.1.84.127
grafana/0*       active    idle   10.1.84.83
loki/0*          active    idle   10.1.84.79
prometheus/0*    active    idle   10.1.84.96
traefik/0*       active    idle   10.1.84.119

Offer         Application  Charm           Rev  Connected  Endpoint              Interface                Role
grafana       grafana      grafana-k8s     64   1/1        grafana-dashboard     grafana_dashboard        requirer
loki          loki         loki-k8s        60   1/1        logging               loki_push_api            provider
prometheus    prometheus   prometheus-k8s  103  1/1        receive-remote-write  prometheus_remote_write  provider
Model               Controller  Cloud/Region        Version  SLA          Timestamp
sample-cos-model    microk8s    microk8s/localhost  3.1.6    unsupported  00:21:19+02:00

App           Version  Status  Scale  Charm             Channel  Rev  Address         Exposed  Message
alertmanager  0.25.0   active      1  alertmanager-k8s  edge      91  10.152.183.215  no
catalogue              active      1  catalogue-k8s     edge      27  10.152.183.187  no
grafana       9.2.1    active      1  grafana-k8s       edge      92  10.152.183.95   no
loki          2.7.4    active      1  loki-k8s          edge      99  10.152.183.28   no
prometheus    2.46.0   active      1  prometheus-k8s    edge     149  10.152.183.232  no
traefik       2.10.4   active      1  traefik-k8s       edge     155  10.76.203.228   no

Unit             Workload  Agent  Address       Ports  Message
alertmanager/0*  active    idle   10.1.142.186
catalogue/0*     active    idle   10.1.142.176
grafana/0*       active    idle   10.1.142.189
loki/0*          active    idle   10.1.142.187
prometheus/0*    active    idle   10.1.142.188
traefik/0*       active    idle   10.1.142.185

Offer       Application  Charm           Rev  Connected  Endpoint              Interface                Role
grafana     grafana      grafana-k8s     92   1/1        grafana-dashboard     grafana_dashboard        requirer
loki        loki         loki-k8s        99   1/1        logging               loki_push_api            provider
prometheus  prometheus   prometheus-k8s  149  1/1        receive-remote-write  prometheus_remote_write  provider
Connect Grafana web interface
To connect to the Grafana web interface, follow the Browse dashboards section of the MicroK8s “Getting started” guide.
juju run grafana/leader get-admin-password --model <cos_k8s_controller>:<cos_model>
Below is a sample screenshot of Charmed PostgreSQL on the Grafana web UI: