Monitoring
The OpenSearch charm integrates with the Canonical Observability Stack (COS) to provide infrastructure and cluster health monitoring through metrics, dashboards, alert rules, and logs. COS uses Prometheus for metrics collection, Grafana for visualization, Loki for log aggregation, and Alertmanager for alerting. This enables monitoring of OpenSearch cluster performance, resource utilization (CPU, memory, disk I/O), cluster statistics (node health, shard allocation, indexing rates), and operational health.
Note
See: How to enable monitoring via COS and Grafana.
Additionally, Charmed OpenSearch can integrate with the OpenSearch Dashboards charm for exploring and visualizing your indexed business or application data. While COS with Grafana monitors your OpenSearch infrastructure and operational health, OpenSearch Dashboards provides purpose-built tools for interactive data exploration, custom visualizations, query builders, and OpenSearch-specific features like anomaly detection. Most production deployments benefit from using both: COS for infrastructure monitoring and OpenSearch Dashboards for data analysis.
Note
See: How to deploy OpenSearch Dashboards charm.
Metrics
The charm enables the Prometheus Exporter plugin for OpenSearch by default: The Prometheus Exporter Plugin for OpenSearch
The meaning of the metrics collected can be found in the upstream documentation:
Alert rules
The charm deploys a pre-configured set of Prometheus alert rules by default.
To ensure you are referencing the latest default alert rules, check the source file of alert definitions in the repository’s prometheus_alerts.yaml file.
Logs
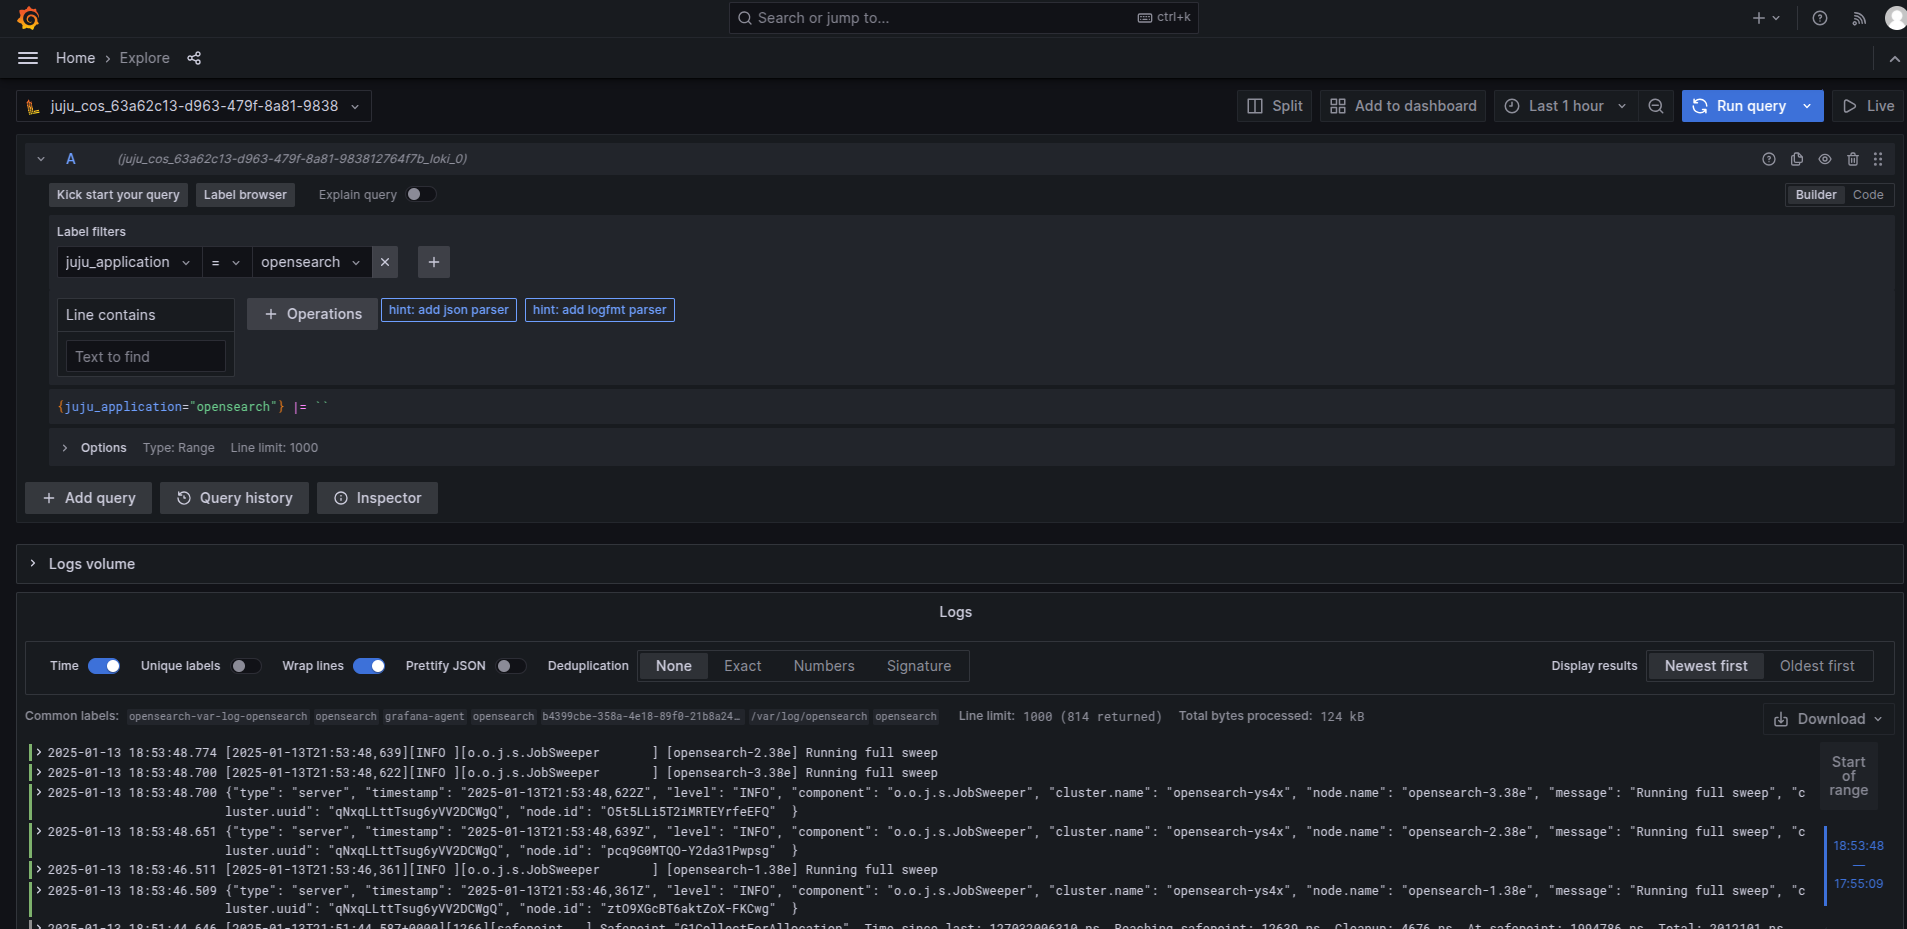
All the logs from the OpenSearch payload are available in the Grafana GUI at Home > Explore
To get OpenSearch logs, go to the Label filters field and set to juju_application = opensearch, select one
operation, e.g. Line contains and run the query.
Grafana dashboard
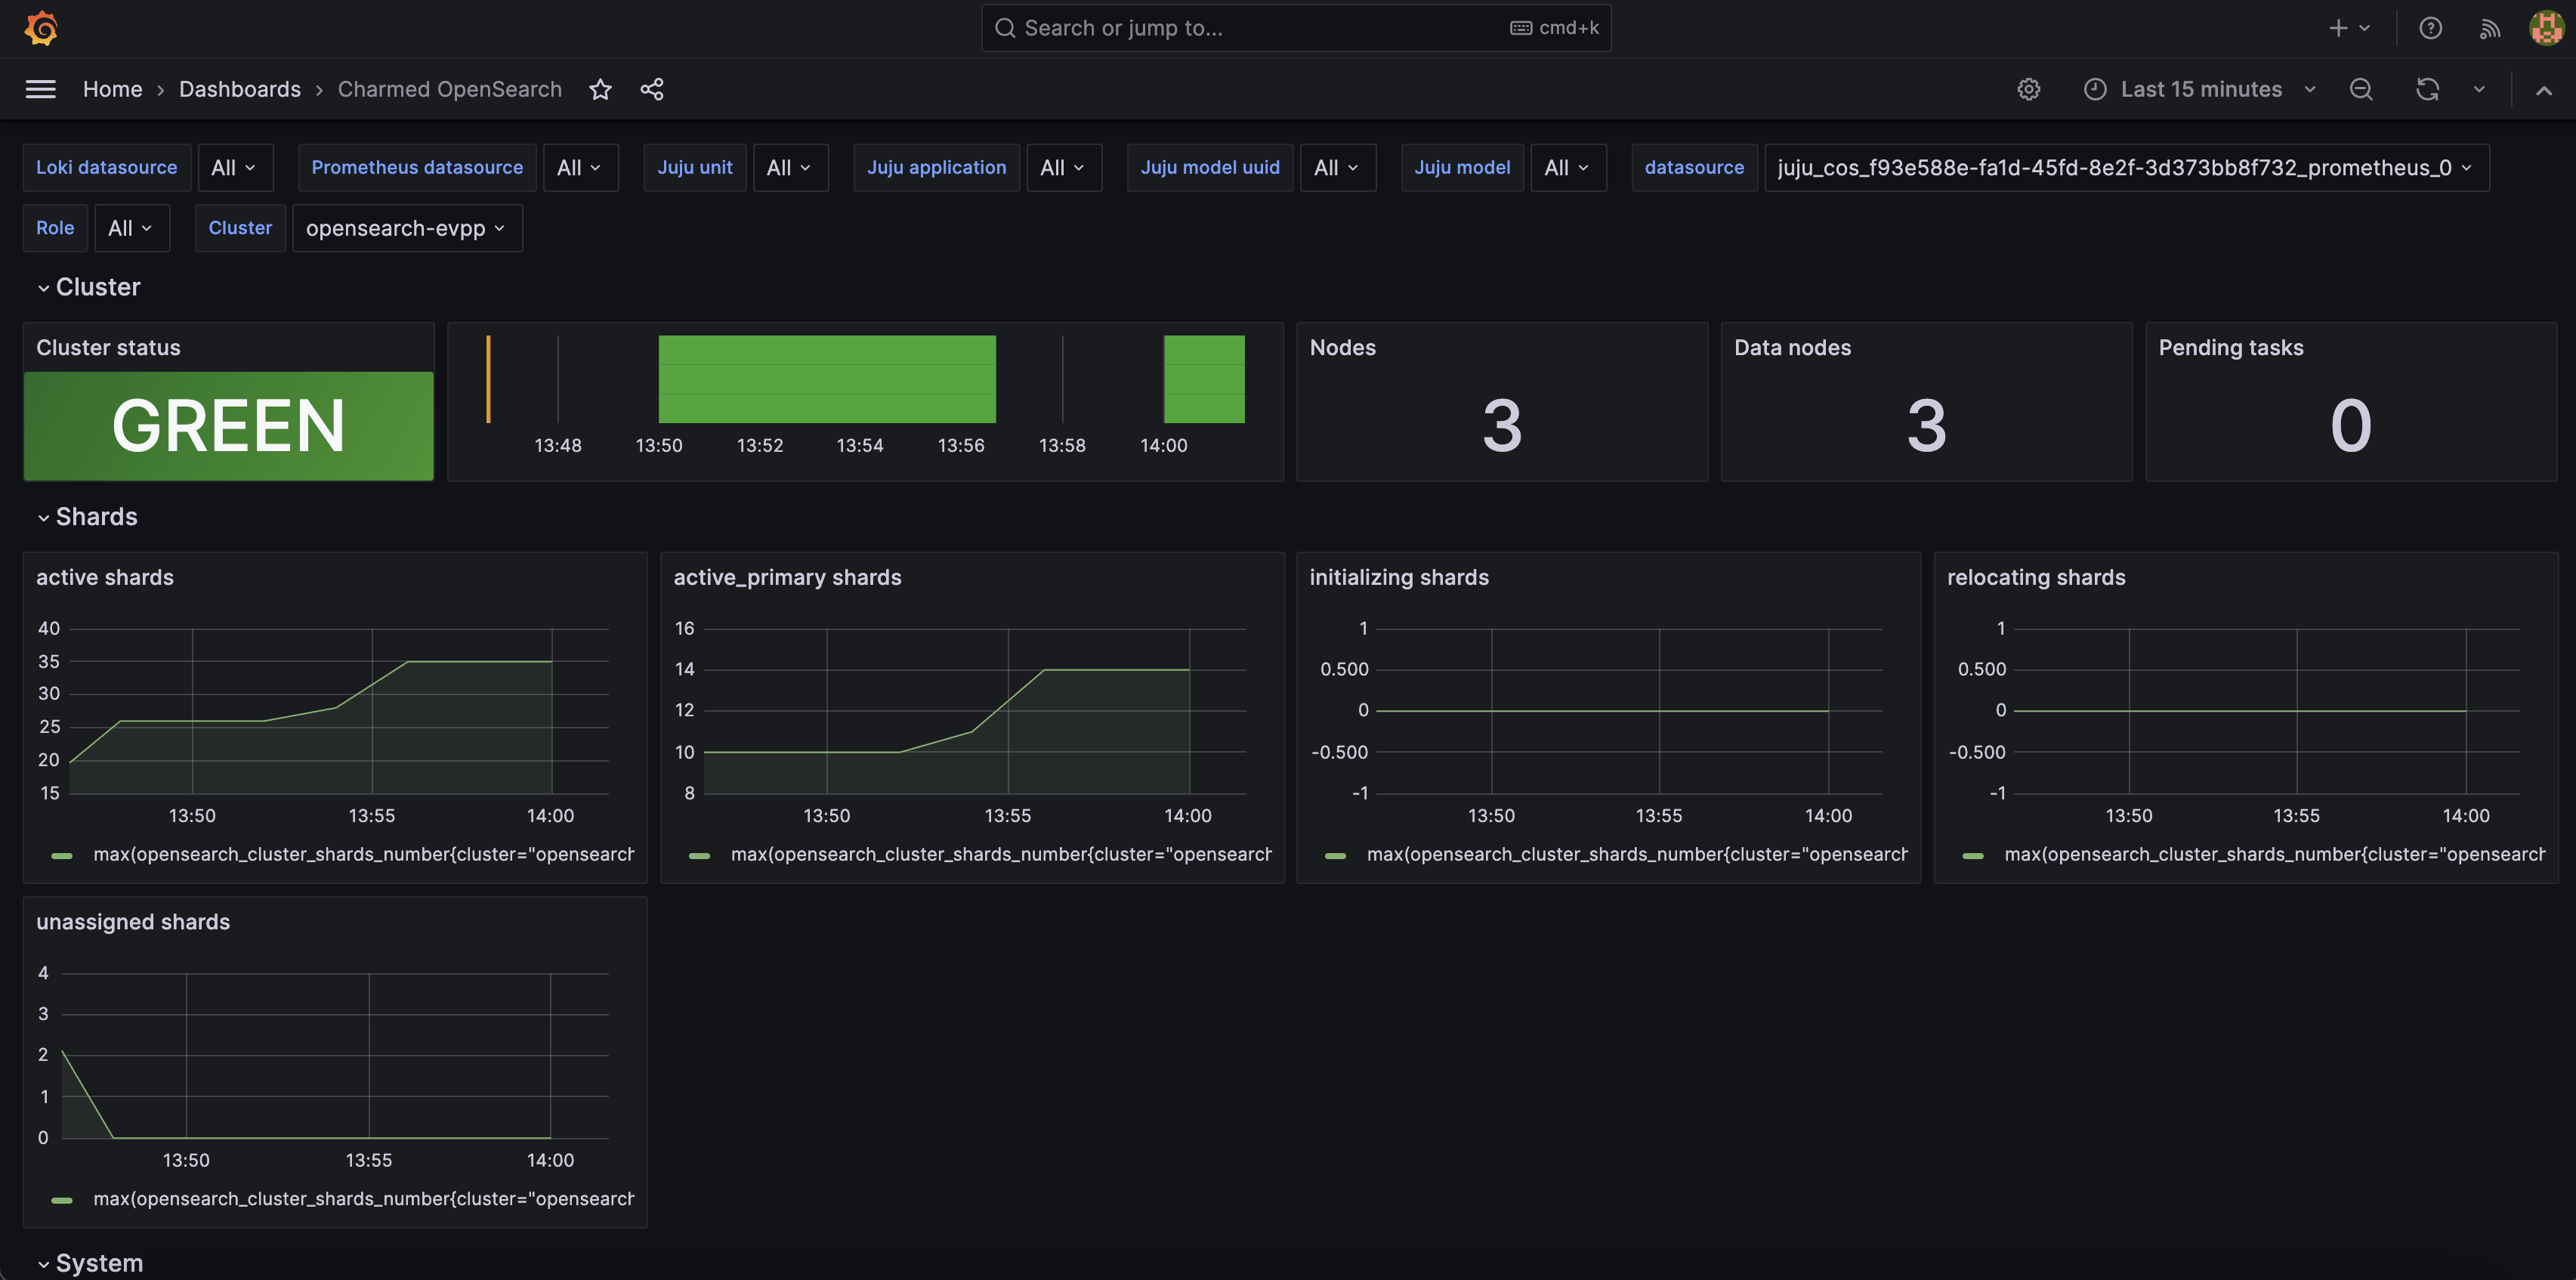
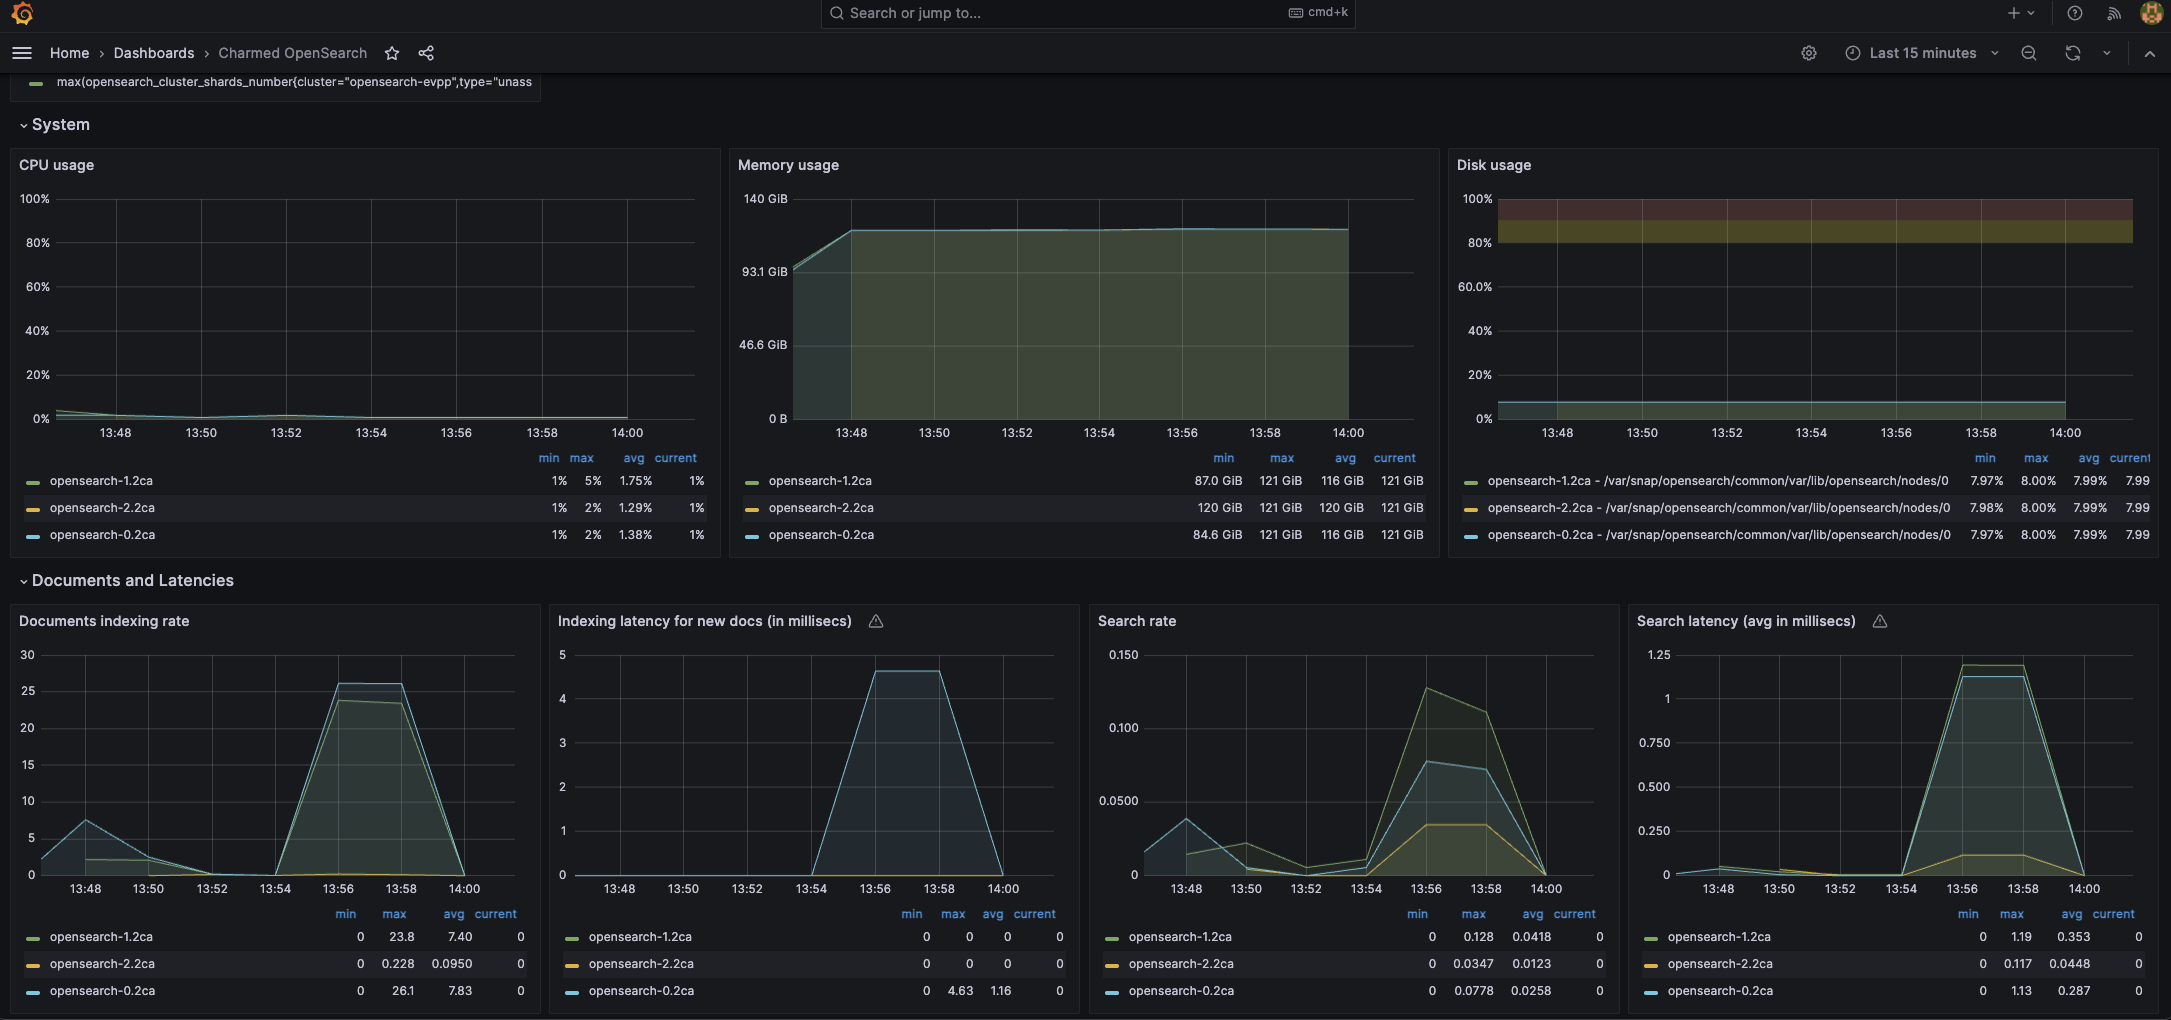
The Charmed OpenSearch Grafana dashboard provides an at-a-glance view of cluster health, node resource utilization, and indexing throughput. The dashboard includes panels for CPU, memory, disk I/O, JVM heap, shard counts, and document indexing rates.
You can filter the displayed data using the selectors at the top of the dashboard:
Juju model — the Juju model the cluster is deployed in
Juju application — the Juju application (e.g.
opensearchoropensearch-main)Juju unit — an individual Juju unit within the application
Cluster — the OpenSearch cluster name (useful when multiple clusters share a COS instance)
Role — filter by OpenSearch node role (e.g.
cluster_manager,data)